Showing posts with label Nifty. Show all posts

Monday, June 20, 2011

Nifty multi time frame trend: Strength of convergence

In my last post on trend indicator I mentioned that there is struggle between short term traders and long term investors which makes trading difficult as the range comes into play and trend gets erratic. Link here.

After that the Trend indicator gave a confirmed sell signal on both the Hourly and 4 Hour time frame. With that the last range was broken and RSI also shifted to bearishness as it broke the support of 30 levels.

Today the index declined 2% which came as surprise to many but our Trend indicator indicated quite early that trend is bearish now.  Attached is the chart.


Confluence of trend gives the best trading opportunity. 

Tuesday, June 7, 2011

Nifty Trend multi time frame The fight of long and short term traders

Nifty has bearish trend activated from mid Friday and after touching the 5480 support the index is now flat.
The bearish hourly trend was of smaller duration.

Were there any indications of that happening? Yes there was.
The answer lies in the higher time frame trend. The 4 hour trend was bullish.

Whenever there is mis alignment of traders (short term) and investors (long term) the profitable trend is less.
It is there alignment also where trend is smooth and trade able.


Monday, June 6, 2011

Nifty Trend indicator in Sell mode

The trend indicator has turned to sell mode on Friday mid day.

The index turned down exactly from the 5600 levels which has been resistance for last 3 rimes.  This was the 4th touch and it has failed to take that level out which paints a very bearish picture. 

The buy from 5427 turned to sell at 5543 levels. 


Thursday, June 2, 2011

Nifty Resistance still holds though picture is looking good

Nifty hit the old resistance at 5600 levels and saw gap down opening. Though the sell off was more news based but our charts predicted that the bull bear line at 5600 matters a lot.

The picture is bullish as the hourly trend indicator is still bullish as price is above the levels.

This is the third time 5600 is hit in last 1 month for Nifty and it has failed to cross. The next touch of 5600 will set the trend.

Nifty in hourly trend.


Thursday, May 12, 2011

Nifty Color update and Bearish Setup

Nifty color on weekly has been on Sell mode from the start of the week. This coupled with the Daily Lev Sell mode is bearish for the index.

Nifty Inside Day and Narrow range setup:

If today Nifty closes below the 5520 levels then the index will break below the low of Inside day. The Inside day has high and lows within last day and is a sign of volatility contraction.
Also the Nifty daily range (High - Low) is lowest among last 7 days which is also a sign of volatility contraction.

So any break form this range can bring a one side move.  This setup when back tested gives a good result and the direction persists for next 3-5 days.


Thursday, May 5, 2011

Sensex: Quantifying Sell in May

There is a very famous investment philosophy to Sell in May and return in October.

Lets see how that strategy works for our Indian Markets.

The conditions are to Sell on first day in May and Buy on first day on October with commissions of 5 bps.
We are testing this from year 1980 and 2010 so that it covers most of the history available.

How are the results? Well, its not profitable. The initial equity of $10K got reduced to $9.8K while buy and hold was massively up by ~2 times.

Here's the snap shot of the performance.


There were only 10 profitable years among the 31 years of testing with the year 2010 contributed massively $4780  to the results.
The profits are completely skewed by a single year.

This clearly shows that the strategy is not profitable in itself but there was one profitable trend. That was the higher probability of a dip in early May which lasts for 2-3 weeks on an average.

Here's the equity graph.


Wednesday, May 4, 2011

Qunatifying Nifty Bollinger Bands : First down side breakout

Nifty futures has given two consecutive close below the lower band and today again opened below the lower band.

The bandwidth also increased after hovering near 52 week lows for some time. The breakout from such a complacency was quite sudden.


The index gave first sign when the bounce from the mid band failed to touch the upper band signifying weakness ahead.  Such a formation when the top remains inside bollinger band has been very bearish for Nifty index. On  break of mid band additional confirmation came from the color system on 28th.

This shows how multiple confirmations can lead to good trade.

The index is now at the trendline support from last 3 lows made in Feb and March. As of now we are trading at the trendline. Any close below this line will be quite bearish for the index.

Related Post:Qunatifying Nifty Bollinger Bands Breakout

Tuesday, May 3, 2011

Nifty and INR : The relation is telling something Part 2

This post is second in a series which shows correlation between Index and Currency. Most of the moves can be detected through this relationship.

In Part 1: Nifty and INR : The relation is telling something  The Rupee breakout told us about the Nifty upmove.

This time the INR has come out of the channel and is trading higher ( or lower in exact sense.) The index meanwhile is still holding the lower channel. Any sustenance of INR above 44.50 can surely be more bearish for the Index.


Monday, May 2, 2011

Nifty and fibonacci

Nifty index has broken the 200 SMA and the 50% retracement levels from the Nov top and Feb bottom.

The fact that the index faced resistance at 61.8% levels itself is a very bearish sign.

Even the bounce from 200 SMA was much smaller than the previous 4 attempts. Are bull taking a leave here?

The daily color of Nifty and Bank Nifty is in Sell mode from Fridays open. Read the color update here.

Friday, April 29, 2011

India futures color change to Sell

Nifty color changed to sell mode at today's open and the Bank Nifty also changed to daily sell mode.


The weekly color is still buy for Nifty and Bank Nifty but the reversal trendline is very close at 5700 and 11200 for Bank Nifty.

Thursday, April 28, 2011

Nifty Two trendlines will define the move

Nifty index has been trading in a range for quite some time.

The index tested the trendline resistance from Nov and Dec highs but failed to cross it. The second test within a week again failed to move above it.
While on the downside the 200 SMA has been strong support for some time.

The daily charts also show another support zone at 5700 levels where the volume profile shows good buying action in the past.

The worrisome part is that the rise from 5700 levels has getting smaller and smaller and in April we had the third bounce which was half of last time and did not last for even 3 days.  This does paint a bearish picture.


Worth noting is the near stagnation at 200 SMA levels without taking out the peak of first test after the breakout from 200 SMA.

Any direction breakout from the above two trendlines will set the direction for future.

Attached is the chart.

Well its not all bearish for Nifty, there is a bullishness also in form of invested Head and Shoulder.  This particular pattern is in formation so have a watch on this.

The bullishness will come only on break above the neckline at 5950 levels.


The volumes which has been lower as per the textbook pattern. Need to watch the volumes on upside breakout here.


Tuesday, April 26, 2011

Trend stalling: Perfect range play

Nifty's upmove looks to be stalled at 5900 levels.
The two consecutive doji with now index below their lows shows that the trend is still of range.

With first test of 200 sma already done the index flattered in 4 days which is not a too bullish sign.

The index has also come inside the flag formation. This itself is not bearish bearish if the index takes support at 5800 and resumes upmove.

Worth noticing is the rsi play for nifty futures. The indicator has been between 70 and 30 levels for last 7 trading days.

Thursday, April 21, 2011

Nifty Point Figure update

Nifty is at crucial resistance of 5950 levels. The index though gave signs of breakout from Bullish flag formation with gap up and good volumes as posted y'day.

The index on Point and Figure charts is also an interesting study at this juncture. The index is showing bullishness with a failed bearish breakdown and is now at triple top resistance.

If it breaks out from this levels then the target comes at 6100 which is also the target of bullish flag breakout.
But the final call will be only on touch of 5950 for spot when the breakout gets confirmed. 


There are multiple lines of resistances between 5900 and 6000 levels so the move can be quite erratic and frustrating. The ideal case would be good volumes at these levels 

Wednesday, April 20, 2011

Nifty Is this a bullish flag formation?

Nifty hourly chart shows a bullish flag formation.

The index maintained bullishness by staying above the 50% retracement levels.
Volumes also picked up in last 2 hours today near the upper end of channel.

Any sustained breakout from the channel is a straight buy as the weekly color is still a Buy.


Tuesday, April 19, 2011

India Futures: See saw at 200 DMA of 5700

Nifty after crossing the 200 DMA is now again at those levels. It has till now stayed for 14 days above the moving average.

There is a great lot of sentiment attached to the 200 SMA. It can be defined as the line between bulls and bears and the same can be seen today as the index is making every effort to stay above 200 SMA levels.

When index is near such levels there can be sometimes multiple testing of such levels as the struggle unfolds between the bulls and bear.So expect more range and reversals at these levels.


Wednesday, April 13, 2011

Nifty Fibonacci chart

Let me post Nifty chart with Fibonacci retracement. The upmove started at 38.2% levels and in process has given a 5 day high closing value that also with above average volumes.

The move has come when everyone was so bearish in the morning. Hearing others view I wanted to change my own view to bearish but then I looked at the color system and saw that the Daily color is still in Buy mode though it reduced from Lev Buy but still in Buy and the weekly was also in buy mode.

This move coming at the trendline resistance from Nov and Dec highs gains importance now as the shorts has been squeezed now.


More details later on the implication of such move.

Thursday, April 7, 2011

Nifty the same old pattern playing again

In the earlier posts there was indication that we can see a Sep 2010 kind of steep rally.  Post 1 and Post 2.

Well that came true and Nifty came to striking distance of 6000 levels and has a 10% upmove and we captured about 7-8% of that move.

What from here? That's a good question and many are questioning the move and many more are searching for direction.

First lets see a chart comparing the Sep 2010 and the present move.


Both rallies had same starting point at 5350 and the same exhaustion  at 6000 levels.

Analyzing further the number of bullish days are 11 and 10. The consolidation days at 5950 were 8 for Sep rally. This time the rally had 3 days as of now.

The index though has one bearish setup of bearish divergence and that also at trendline resistance from last 2 tops at Oct and Dec. But seeing Hing Kong index breaking out from such a similar setup the bullish options are open. HSI chart:


The recent volume action in Midcap and small cap index with better A/D across broader market weighs higher for bullish options.

Tuesday, April 5, 2011

Nifty and SPX in X O view

The Emerging market ETF EEM has broken out of the consolidation. Read the post here.
The etf is relatively bullish than SPX which is a major turn in the assets allocation globally.

Lets see how Nifty is performing relatively.
First Nifty vs EEM in a relative chart:


The ratio has been in range for quite some time and has is at the resistance trendline.
The 50 SMA is getting flat which is a good sign.

This shows that India is still underperformer in emerging markets.

Now hows the Nifty vs SPX. Well that's showing bullishness.
There is first breakout from the double top of X's which is highlighted. Though it is still below the bearish trendline but the ratio has rising bottoms.

So overall Nifty is for sure signs of bullishness but the months of under performance still lingers and that itself can be good trigger for buying by funds.

Friday, April 1, 2011

Nifty: Why 2011 is not 2008? Pattern repetition not happening

The 2011 first quarter looks quite similar to 2008 first quarter in some respects.

The market makes a top and then sharply falls. Then after being sideways for 4-6 weeks a rally comes. The rally soon falters and rest is history.

But the study shows that the pattern will not repeat itself. The initial analysis suggests that the signature of the move is different but the complete answer can be know in next 2 weeks i.e. by mid April.

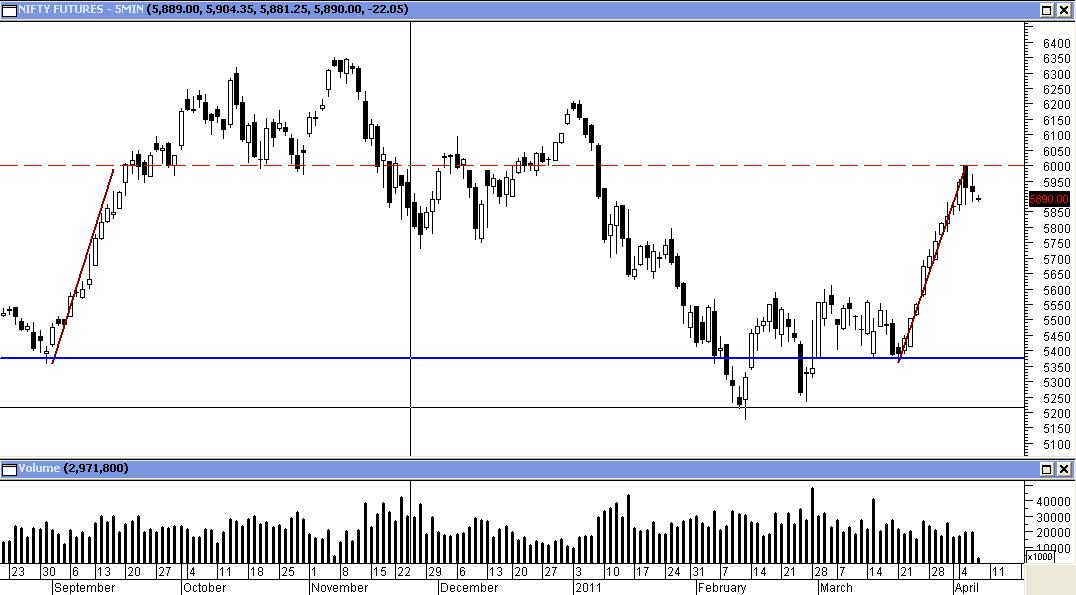
First the charts showing the two periods.


The pattern though looks quite similar as mentioned but the key differences are:
1. The rise after the fall has been much stronger this time.
2. The volumes are better on rise for this rally.

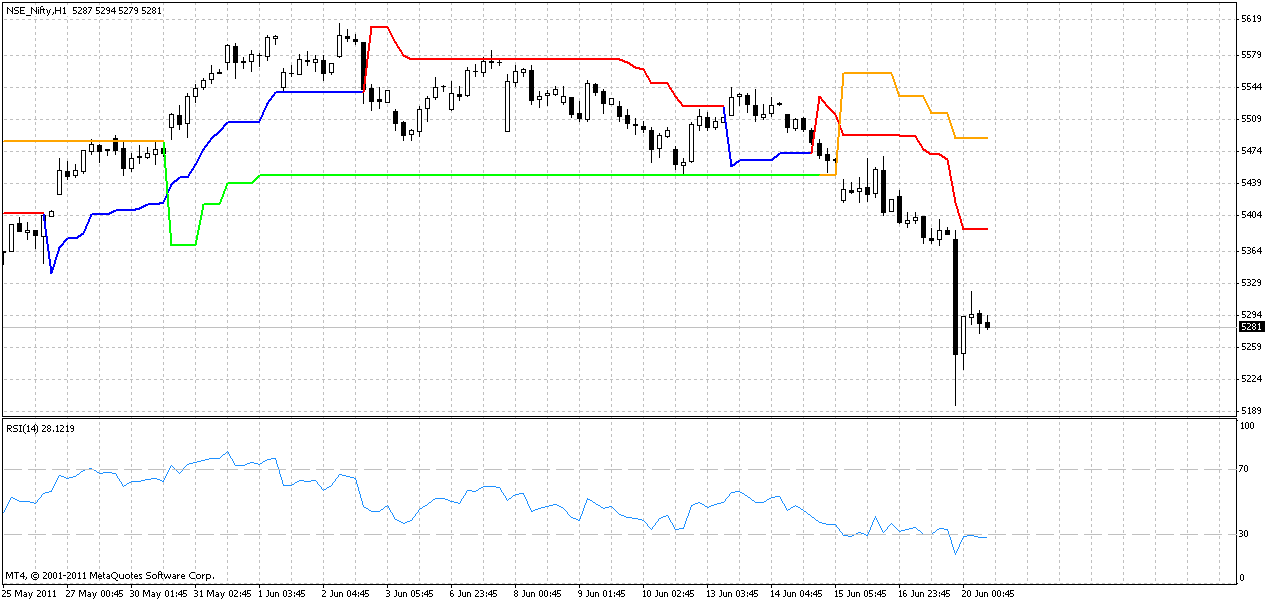
Analyzing the 2008 pattern the index was above the 50 week SMA for 2 weeks and then in 3rd week the index closes below the 3 weeks low. The high of that week then becomes the resistance with ~20% fall coming on break of the crucial point of breakout from 50 week SMA.


The above are quite famous pattern for any down leg and is called A-B-C pattern. More details later.

Now coming to present, the Index has come out of the 50 SMA and will close above the 50 SMA for 2nd week in a row. If we consider this week as breakout point then the weeks low at 5660 is the crucial low to be maintained. For any fall to come then the next 2 weeks will be pointer.

So the 5650 (~ lows of 5660) will be the decider for the pattern.Keep watch on those levels.

Tuesday, March 29, 2011

Qunatifying Nifty Bollinger Bands Breakout

The recent upmove in Nifty is definitely a good study case for Bollinger Band breakout study.

The index has broken out of the upper band and has been staying above the upper band for last 3 days.

In the last post I mentioned some of points which came into play in this move. Do read this post link here.

Since the main trend before this breakout was of range trading we needed two consecutive close above upper or lower band for any breakout to succeed. See Point # 2.

This time it happened. Also the index had one of the biggest move on first breakout  (> +2%) which was followed on the next day with ~ +1% close. The volume action was all out in favor of bulls on breakout.

This was one of the best breakout which we quantified earlier.

One thing to notice in such breakout was rise from range. So the bollinger band expansion should happen.
Well that's quite evident as the uptick in the Bollinger bandwidth. See chart attached.


Related Posts:
Qunatifying Nifty Bollinger Bands : First down side breakout
  
Nifty and Bollinger Bands: Range trading indications
  
Quantifying: Nifty and Bollinger Bands Strategy