Sunday, February 6, 2011

Tin: Where is it heading?

Tin a very less know metal is making new highs and has even crossed the 2008 peak. Only the chart.


Saturday, February 5, 2011

US Sectoral Trend: Energy momentum powering ahead

Looking at the US sectoral trend for year to date, XLE i.e. S&P energy ETF  has outperformed SPX by 4% and is best sector.
The other two sectors giving +ive returns were Technology (XLK) and Industrials (XLI).

The snow effect is visible in Cons Staples and Cons Disc sectors as they were under performer by 4% and 2%.

The Utilities has been down for quiet some time. Financials which were leading are now performing in line.


Worth noting is the consistent leadership of Energy sector for last 6 months. There is a momentum theory in play here.


Friday, February 4, 2011

What happened to markets? Did we miss anything?

What a sell off, looks like someone exited India in a big way.

We were Neutral in morning but added shorts at break of 5490 levels which was the trigger for larger sell off.
The daily and weekly being still in Lev Sell any slight short opportunity can be taken to enter the market.


Meantime look at the post here and here. These all are long term signals which were posted quite earlier.


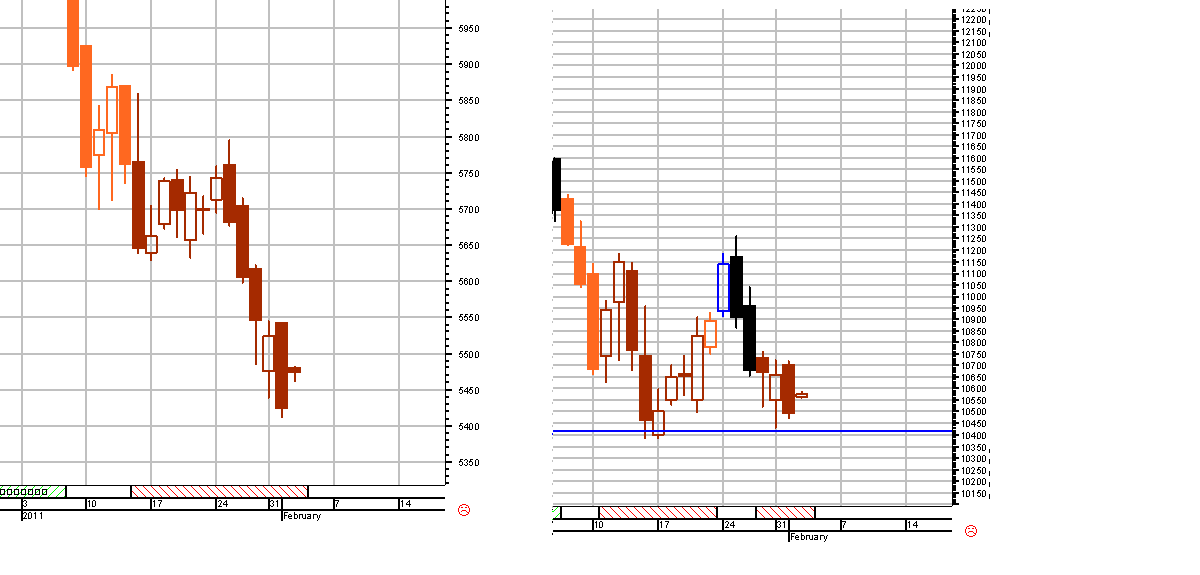
Nifty: Are we out of zone now

Nifty moved up nicely after the short covering call. Rest of the shorts were also covered at 5500 levels.

So are we heading to bullish area now. Well that's worth waiting. Bank nifty is already in reduced buy mode with Nifty in Neutral mode.


The upside resistance for trading purposes is at 10900 and 5600 levels.  Bank Nifty coming out of bearish zone faster than Nifty shows its bullish relative strength. If the strength continues than it would be better to take bullish view in Bank Nifty.

Better to be in Neutral/reduced buy at this stage as bullish confirmation is still not there.

Thursday, February 3, 2011

Dow Theory: Sign of caution or Crude effect

The latest signal from Dow theory is of caution. The last sign was of bullishness when Indu was at 11250 levels. Post here.

Now the Transports has broken the 50 DMA and has last swing high below 50 DMA while the Industrials INDU is trading above the 50 DMA. Chart:

While this could be the effect of crude as Transport companies use crude as their primary input and is there main cost. If crude stays above 90 levels then for sure it could have some effect on the Industrial index also as crude is used in every aspect of life which could for sure increase the inflation. More discussion can lead to debate here.So lets see charts.

The second way we can look at this is that divergence can be a buying point for Transports as Industrials is still at new highs. For that lets see how the broader US indices are telling us.

Not much of signs of caution in Midcap and smallcap indices.

Crude has moved to new highs though failed to cross the resistance there. The structure is still bullish of crude.

This all could be attributed to Egypt effect which lead to fresh highs in commodities. Reuters commodities index CRB broke to fresh weekly highs. Link here.

Futures showing divergence: Time for partial profits

Nifty and Bank Nifty are showing multiple divergences at these levels. The support of 5400 was held for second time in a row and Bank Nifty again showed strength compared to any other sector.

While daily color still being Lev Sell, I feel that some partial profits can be booked at these levels and let some shorts run which can be exited at proper signal. Nifty 5465 and Bank Nifty at 10570.

Shorts can further be added if we break today low. It is the last legs of wave at support levels get tricky. Its the same at 5640 getting repeated at 5400.

Wednesday, February 2, 2011

India: Analysing January effect on year

January barometer is most discussed for predicting the year end returns for any index.

Lets analyze the January effect on Indian markets. Although the Sensex does not century old data so that we can draw some conclusion with large set of numbers so lets see whatever we can find out with the 30 years of data.

The preliminarily data shows correlation of 0.23 with R square at 0.054 which is quite weak for making any direct statistical analysis. This is evident from the following chart also. There are large number of outliers from the linear trendline.


Going further lets apply some filters and see if we can good data coorealtions. The first filter can be of bands of price change and then finding the probability. Following is the analysis:

The probability of  having a bullish year for a negative January is at 62% which is quite high. But wait.

The last 2 rows shows show the returns with price filters. And both of them have very less probability of bullish year.
The Jan 2011 had -11% returns so the last row shows bullish year has chances of 25% with average change of last occurrences at -11% which is quite bearish figure.


Nifty Bank Nifty update 2 Feb

The gap up opening today is very much part of the high volatility and the key support of 5400 levels for Nifty. Holding 5400 is the life line for bulls.

This being the first gap up in the downtrend will be crucial future direction decider. This is best point to know the strength of sellers as they get a real good point to sell where the bulls have head start. Worth watching the action.

Today partial shorts can be cut at 5515 levels for Nifty and 10700 levels for Bank Nifty. The daily color is still Lev Sell.


Worth noting is the recent out performance by Banks w.r.t other heavy weights.

Color charts.

Tuesday, February 1, 2011

Egypt effect in charts

Lets see the effect of Egypt in charts.

First Egypt index. There is 20% staright fall in just 1 week.


Now the commodities. CRB Index broke out and is now at 52 Week highs.
Most important if we look at what are major commodities Egypt trades, there are two main: Oil export and Wheat import.

Oil everyone knows so here is the chart of wheat. This particular commodity is up because whole of middle east imports it and the last thing they would want is food riots.

State of Market 1 Feb: Breadth is at extreme lows: No signs of buy now

State of Market report tries to capture the pulse of broad market by analyzing the stocks and other factors of market breadth. The previous issue was about the stocks diversion from 200 DMA and the breadth did pulled Nifty below 200 DMA. Link here.

The bearishness still remains at extreme though some divergence is there at the lows today. Analyzing the stocks color with last report.


Worth noting is that Markets have come down but the breadth slightly has improved since 19 Jan as seen above.

This kind of divergence generally happens in the last leg of fall although this can keep on changing, so no perfect conclusion can be drawn fro this alone. Since the above stocks are liquid ones lets see the broader market picture if there is any such divergence.

The broad market index BSE 500 does not show any kind of divergence. BSE 500 stocks vs 200 DMA.

The stocks below 200 DMA has now increased to 80%, earlier it was 67%.


Going further let me analyze  the New high and New lows and the Advance Decline graph for NSE as a whole.
 While the new highs are getting less and less the new lows are increasing. There is no divergence on that chart as well.
The Advance Decline line is downward sloping one suggesting the selling pressure is huge at every highs.