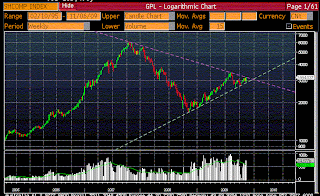
SHComp index has an interesting trendline formation on weekly/monthly charts.
The index has taken support at the Mar 09 and Oct09 trendline till now while at the same time it is now at resistance of trendline from 2008 highs and Aug'09 highs.
This does not qualifies as a triangle technically. The volumes have been higher on upmoves which shows a possibility of a break on upside. The elliot count also in corrective wave.
What is interesting is that the break out direction will set the stage for the world indices as shcomp has been leading index till now.

No comments:
Post a Comment