Showing posts with label Only Chart. Show all posts

Thursday, May 12, 2011

Silver Swing high below 50 DMA

Silver is making swing high below the 50 SMA.

The daily RSI has also failed to cross 50 levels and in now trading below 40 levels.


Wednesday, April 20, 2011

Nifty Is this a bullish flag formation?

Nifty hourly chart shows a bullish flag formation.

The index maintained bullishness by staying above the 50% retracement levels.
Volumes also picked up in last 2 hours today near the upper end of channel.

Any sustained breakout from the channel is a straight buy as the weekly color is still a Buy.


Wednesday, April 13, 2011

Nifty Fibonacci chart

Let me post Nifty chart with Fibonacci retracement. The upmove started at 38.2% levels and in process has given a 5 day high closing value that also with above average volumes.

The move has come when everyone was so bearish in the morning. Hearing others view I wanted to change my own view to bearish but then I looked at the color system and saw that the Daily color is still in Buy mode though it reduced from Lev Buy but still in Buy and the weekly was also in buy mode.

This move coming at the trendline resistance from Nov and Dec highs gains importance now as the shorts has been squeezed now.


More details later on the implication of such move.

Thursday, February 24, 2011

Nifty recent swing with fibonacci

Nifty's recent swing with the bounce failed to close above the 200 DMA and the 38.2% retracement levels indicates bearish trend is not over as of now.

Only Chart


Thursday, February 10, 2011

Wheat going higher and higher

Lat time I wrote about wheat in Egypt crisis post.

The commodity since then is making new highs and is at fresh 52 week highs.
It has been just 9 days since then and the commodity has moved up 8% since then. Good to know that kind of move especially when one is trading India which is making new lows now.

There are couple of global events and clomate factors behind this kind of move. Here is the chart:

Tuesday, February 8, 2011

Hong kong going the indian way

Hong Kong index HSI has formation quite similar to Nifty charts of early Jan.

The HSI index has lower top formation with index struggling at key trendline support of the Sep rally. It is holding the 50 and 100 DMA for now. The 50 DMA though appears to be exhausted as it has been flat for last 1 month.
Keep any on the charts for now.


Sunday, February 6, 2011

Tin: Where is it heading?

Tin a very less know metal is making new highs and has even crossed the 2008 peak. Only the chart.


Tuesday, February 1, 2011

Egypt effect in charts

Lets see the effect of Egypt in charts.

First Egypt index. There is 20% staright fall in just 1 week.


Now the commodities. CRB Index broke out and is now at 52 Week highs.
Most important if we look at what are major commodities Egypt trades, there are two main: Oil export and Wheat import.

Oil everyone knows so here is the chart of wheat. This particular commodity is up because whole of middle east imports it and the last thing they would want is food riots.

Monday, January 31, 2011

BRICS in charts

The following is the BRICS in charts. Russia looks like is not a member as it is the only index above the 50 DMA.


Friday, January 28, 2011

Nifty X & O chart setting up for more downside

The Point and figure charts are getting more bearish for India. In my last update the index broke the triple bottom which is a bearish sign. Post here.

Now the index has given  a bearish catapult breakdown which is a high conviction sell signal. The target comes at 5250 levels.

Attached is the chart.


Thursday, January 27, 2011

Euro reversal at key fibonacci level

Euro today gave first reversal signal at key level of 1.3700. This levels is very near to key psychological level of 1.3800 for the pair.

The current level is also significant as it is 61.8% retracement of the move from 1.4275 to 1.2870 levels.


Another significant factor to watch is the Dollar Index which has hit the crucial support of 78 levels.

Observe the rolling over of the macd in DXY index. This combined with RSI peak around 55 levels seems bearish now.
Lets watch the action at these crucial levels.

Monday, January 24, 2011

India Nifty Bank Nifty update 24 Jan

Bank Nifty has recovered and is now above the 10750 levels crucial for bullishness on hourly charts.
The index though is in Sell mode on daily (but will be neutral above 11000 levels) which makes it a reduced buy only above 10750 levels.

Nifty has given a lot of whipsaws last week and the index had a flat close on weekly basis.
The shorts was stopped out on Thursday and Friday with no gains indicating more range bound movement going ahead. The upside resistance is at 5800 levels with support at 5640 levels.

Bank Nifty hourly signal with Nifty channels.


Friday, January 21, 2011

Gold & Platinum: Two different ways

The two precious commodities Gold and Platinum are headed into different directions.
While I was bearish on Gold form Dec (Post here) and the commodity did came to target of 100 DMA (Post here), the Platinum has broke out and is at new highs after breaking of old top made in Nov.

Attached are the charts.


There is a fundamental reason behind this divergence. Since Platinum is mostly used in cars and recently there has been increase of demand of cars in China its import of metal has increased much more and this has lead to breakout in prices.

Thursday, January 20, 2011

Wednesday, January 19, 2011

SPX : Magic of 10 DMA in Bull phase

The chart shows the power of 10 SMA in bull phase. Every decline is a buy. But how long?
Just the chart.

Tuesday, January 18, 2011

DAX futures (GX1) what a breakout!

Here is the DAX futures GX1 breakout. No words just the chart.

Thursday, January 6, 2011

Trade Example: Bull Phase Entry points


This post is to highlight some of the good entry points for the Bull phase.

The best entry points are on declines to suitable level where buying emerges. One such entry points is the 50 SMA where many times the buyers enter in a big way and propel the indices to new highs.

One such example is recent bull phase in SPX.
The index has been in the bull phase from mid Nov.  Whenever the index touched the 50 DMA it made a new high.

Highlighted are 3 points on 4 hr charts when the SPX made a new high. Most recent was y’day when it declined to 1256 levels but then closed at new yearly high.  Now the catalyst was ISM report and Employment numbers but the charts were foretelling that this is a good entry point for the upmove.

Attached is the chart.


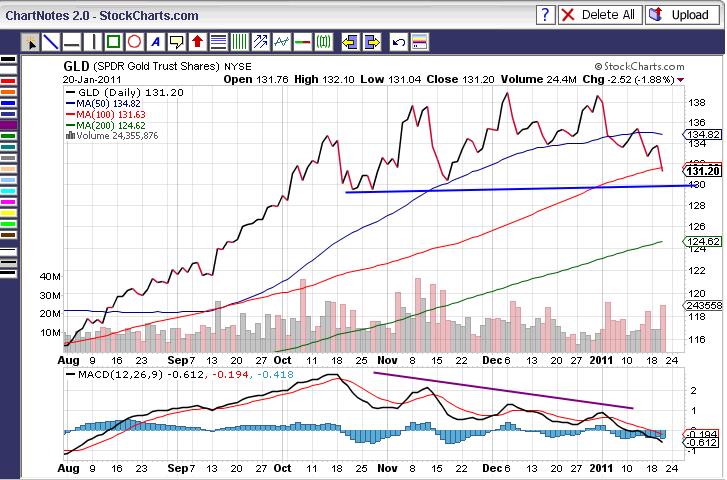
Well, the above trade is not as easy as many other factors need to be considered to differentiate good entry so that risk reward is favorable. Example is Gold decline in last 2 days.It failed to move up on touch of 50 SMA on daily charts.


I will make a detail system with proper back testing results for the above system