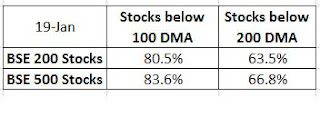
State of Market report tries to capture the pulse of broad market by analyzing the stocks and other factors of market breadth. The previous issue was about the stocks diversion from 200 DMA and the breadth did pulled Nifty below 200 DMA. Link here.
The bearishness still remains at extreme though some divergence is there at the lows today. Analyzing the stocks color with last report.
Worth noting is that Markets have come down but the breadth slightly has improved since 19 Jan as seen above.
This kind of divergence generally happens in the last leg of fall although this can keep on changing, so no perfect conclusion can be drawn fro this alone. Since the above stocks are liquid ones lets see the broader market picture if there is any such divergence.
The broad market index BSE 500 does not show any kind of divergence. BSE 500 stocks vs 200 DMA.
Going further let me analyze the New high and New lows and the Advance Decline graph for NSE as a whole.
While the new highs are getting less and less the new lows are increasing. There is no divergence on that chart as well.
The Advance Decline line is downward sloping one suggesting the selling pressure is huge at every highs.
The bearishness still remains at extreme though some divergence is there at the lows today. Analyzing the stocks color with last report.
Worth noting is that Markets have come down but the breadth slightly has improved since 19 Jan as seen above.
This kind of divergence generally happens in the last leg of fall although this can keep on changing, so no perfect conclusion can be drawn fro this alone. Since the above stocks are liquid ones lets see the broader market picture if there is any such divergence.
The broad market index BSE 500 does not show any kind of divergence. BSE 500 stocks vs 200 DMA.
The stocks below 200 DMA has now increased to 80%, earlier it was 67%.
Going further let me analyze the New high and New lows and the Advance Decline graph for NSE as a whole.
While the new highs are getting less and less the new lows are increasing. There is no divergence on that chart as well.
The Advance Decline line is downward sloping one suggesting the selling pressure is huge at every highs.


