Monday, February 28, 2011

Technicals before Budget: Range is wide.

Lets see what the Technicals for Nifty and Bank Nifty are before the Budget.

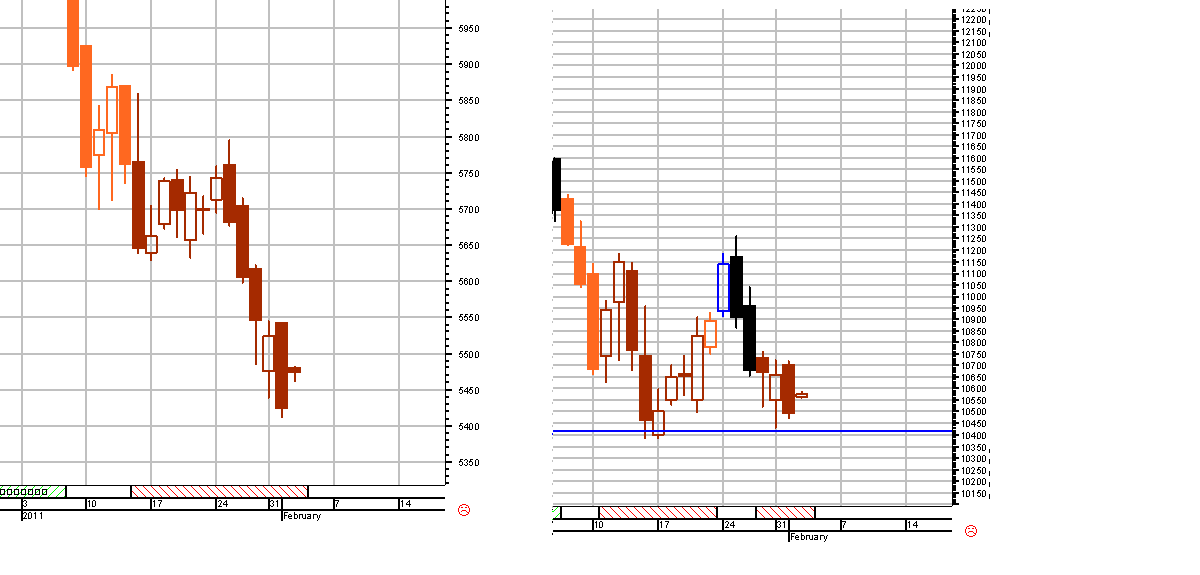
The color on daily chart is Lev Sell for Nifty and Sell for Bank Nifty. Both the indices has not broken the last low at 5175 and 10030 levels.
The candle for Nifty is Bullish Hammer indicating sideways/bullishness if 5230 holds.

The lower bollinger band is not broken for the indices.

The weekly is Lev Sell for both the indices. The weekly RSI though is showing signs of base formation at these levels.

To summarize the markets are in Sell mode but the immediate trend is range of 5430 and 5230. That's the range of 4% in Nifty. This wide range at the lows of 5250 levels shows nervousness of the market.

If the markets rise after Budget then the recent Bottom will be good support for few weeks.


Saturday, February 26, 2011

Plotting Nifty IV ride.


Index IV’s generally shoot up on events like the coming budget for India. 
The current IV is at 29 levels, although not new high for the year but highest for last 6 months.

Plotting IV for Nifty shows a very peculiar pattern.
While the IV’s were declining from May highs of 34 to 52 week at 13 in September just when the Index short off to new highs. The IV’s then broke out of the falling trend line.

From September onwards they have been on a very different path. The initial rise was contributed by the perpetual writers getting caught off guard. After that the Nifty rose to high in early Nov and IV declined to below 20 levels. It is then the whole ride has been turbulent.

The decline from highs of early Nov led to rise in Nifty IV as no the fall off was sharp 7-8% of index.

What is worth mentioning was that the Options market was factoring in the Santa rally as the Nifty IV were declining from high of 23 on 12th Dec to 15 by Dec end. The index rose by 4% during that period.
Declining IV shows complacency as the buyers are rushing in for protection.


The start of New Year 2011 has been one of the most tumultuous rides in index.
The Index declined 10% in Jan followed by another 3.5% decline in Feb. No wonder that the Nifty IV bounced from lower band at 15 and now at way above the upper band.

Once the Budget event is over one the Nifty IV can possibly cool down to mid band at 20 levels. But that depends a lot what is there in Budget.

So what in the options market betting on for Budget?
The current Nifty SKEW of move of 2.5% in index is at 3 Volatility points.

Friday, February 25, 2011

Indices color change, Range breakout

The color of Nifty and Bank Nifty is now in Lev sell mode after break of 5400 and 10600 levels. The color change was expected y'day itself. Read here.

The weekly was already in Lev Sell mode and the index reversing from mid band is a continuation of bearish signal.

Watch the bollinger bands now. Will the lower band at 5220 will be broken? What are the implications if the lower band is not broken? Will post that later.

Here is the action in the hourly charts. See what happens when the breakout from range happens.


Thursday, February 24, 2011

Nifty recent swing with fibonacci

Nifty's recent swing with the bounce failed to close above the 200 DMA and the 38.2% retracement levels indicates bearish trend is not over as of now.

Only Chart


Dow theory update: Rally is under threat

The last Dow update was just a week earlier where the outlook was bullish when the Dow Transports made a new high negating the effect of crude which was a sign of caution.

Now the Transports have broken the previous swing lows and has closed below the 50 DMA. The volumes were also more than average this time. What is worth mentioning is that the decline has persisted for 2 days and both days were more about 1% decline.

The RSI and  Macd was already on bearish divergence sell signal.  Chart.


The current effect is due to Middle east disturbance which is escalating day by day and can have wider geopolitical risks. The biggest is the crude shock. The last one was in 1971 which we have to study in detail to know the effect. Will post the results about that later.


India futures: Break of range trading possible

Indian indices are trading within range for last 4-5 days with narrow range and inside day formation at the middle ground of bulls and bears.
The index has given many whipsaws in trading which is key feature of range trading.

The 120 min bollinger band has been a good indicator to trade during this range period.. Will update about that later on in detail.

The daily colors are still neutral as of now but can come sell on break of range of 5400 and 10700 for Nifty and Bank Nifty.

Best would be stay light and learn something new.

Wednesday, February 23, 2011

Most Read posts. Do have a look

I am posting the most read posts on this blog. People do have a look what is the most popular here.
And if you have not missed any of the below post do read them.


Many of the above posts were at critical juncture of the markets.

Nifty index constituents in a different flavour

Nifty has 50 stocks and each of them have different weight age. Just 3 stocks, Reliance, Infosys and ICICI have about 25% of weight in index price computation.

This makes the index tilt more towards the price movements of the these stocks. What about other quality stocks whose price movement has less effect on index. What if we increase there weight so as to better reflect the movement of broad stocks. Well there is such a way of index computation called equal weight where all the constituents have equal weight.

The S&P500 equal weight index returns completely overshadows the S&P500 index.. See the chart below:

The equal weight index has completely beaten the SPX over last 10 years and has outperformed by a factor of 20 times. Astonishing.

What if we do the same study for Nifty. As the equal weight index data for Nifty is not available we can have to make the custom index incorporating all the change in stocks.
The calculation is very tiring as we have incorporate the changes of stocks. Barath the excel guy made this possible. Many thanks to you dude.

Lets plot the Nifty and equal weight index from 2005 onwards.


The index has not outperformed the Nifty. What does it signify. To me it seems that the top 5 constituents have outperformed Nifty while the bottom 10 has underperformed the Index from 2005 onwards.


Tuesday, February 22, 2011

Ril BP deal what a +ive after a long time

Ril and BP deal announced y'day is a very bullish event for the Ril and the markets as a whole. This is one of the biggest FDI for India.

This particular event has key to change the face of India Oil and Gas sector. Just imagine the improvement is Technology which can come to India.

Being cash accretive, Ril can now focus on expanding to new sectors like wifi, retail and anything they want.

Coming to Markets, confusion previals with conflicting signals on daily and weekly charts. Can expect some range trading at these levels.

Monday, February 21, 2011

India Sectoral Trend Weekly 18 Feb

The last week was all bullish and while the indices were in Lev Sell mode on weekly basis.
The relief rally was captured by being in reduced buy mode.

Such a move was expected as the breadth was unusually -ive. All sectors were in Lev Sell/Sell mode with New lows hitting "new highs". The State of Market report for more details. Link here.

The current weekly color is here:


India Futures failure to maintain the bullish gap

Indian Indices on Friday saw strong sell off. The bullish formations were negated like closing the bullish gap formation. This is very typical in a Weekly Lev Sell color.

The longs were booked at break of 5550 levels and 11050 levels.

Now the indices are at crucial support levels on daily charts as the retracement till now is healthy. The downside support is at 5400 and 10700 levels. Till then the indicators are neutral.

For your observation: The index gave bearish signs (+/- 0.5%) at  the mean reversion levels we discussed.

Friday, February 18, 2011

Dow Theory another Bullish confirmation

The Transports Index made a new closing high y'day. Last time we observed the Transport index was at 50 DMA while the Industrial was at new high. The main observation was that it was due to high crude effect. Post here.

Now with Tran index closing at new highs it is bullish confirmation as per Dow theory principle.


Way to go Dow.

Now since US indices is in bull phase what could be the implications for emerging markets esp Indian markets.

This is a whole macro trade here. My call is to confirm the earlier buy of companies exporting to US/Europe. That call was in mid Dec. Link here.

The IT sector coupled with Gems exporting and a few commodities centric sector can do well based on this macro play.

Nifty Bank Nifty non stop rally

The Indian Indices Nifty and Bank Nifty has rallied for last 6 days. We had longs from 5375 and 10400 levels. See the post here yourself. What a rally.

The Bank Nifty and Nifty are now in proper buy signals.

This kind of rally is always expected when the street sentiment is so skewed to one side move and the move always happens in the opposite direction. In the earlier post we made that sentiment call.

What now.  Well, Indices closing in green for last consecutive 5 days with the best ever breadth of recent times. This combined with no down ticks at the crucial mid band mean reversion point is bullish sign.
The index has held the earlier upside gap with one formed today so it surely seems that the current wave has way to go.
The next logical resistance is the 200 DMA at 5625/5630 levels and the Fibonacci resistance at 5610 levels could be possible profit taking points although watch for down ticks there.

Thursday, February 17, 2011

India Futures Color changed

The daily color of Nifty has changed to Neutral if it holds the 5450 levels and the Bank Nifty has been in Buy color from 10700 levels.

Worth noting is the mean reversion of Nifty to mid band from the lower band. This is an important level as the previous trend gets negated and the Index has got a fresh new start if the mid band holds. The bullish trend usually stops here if the bulls have less power.

Another formation to keep an eye would be falling ADX. See ADX related posts here.

This also indicates that if the 5400 level holds then we can expect some range to slightly bullish movement ahead.


Tuesday, February 15, 2011

India futures: Bank Nifty outperformimg

Bank Nifty has continued its stellar performance with 8% rise from 10K levels.
This was expected as Bank Nifty has been relatively out performer to Nifty in Feb.

The Bank Nifty is now in reduced buy mode from 10400 levels with Nifty from 5375 levels.
Since this is the first bounce we can be cautious for down ticks.

Bank Nifty is now at crucial trendline resistance which has contained the fall. So it will be worth watching if the uprise stalls at these levels.

The street confidence is so skewed to sell that the consensus is to sell on rise. While this has been done for last 3 weeks will it sustain more. How come all people feel the same and that also with so much conviction.

Could the tide turn at this much extreme sentiment? I feel that given the strong view there could be some fall in short term but further than that the macro event of Budget comes into play.

Is there any seasonal pattern to Budget time indices return. We will found out in later posts.

Monday, February 14, 2011

India Sectoral Trend Weekly 11 Feb

Last Week was all red for Indian markets. The Nifty index self was about 1.5% down and the only savior was Friday when the markets closed up.

The sector breadth was all -ive with the bias in strong sector like IT also turning to sell now.

Not a single sector was in Buy or Neutral color as of Friday 11th.

This could prove a major turning point as the breadth has never been so bearish since Mar'09. Any further continuation of the trend for next 1-2 weeks will break the overall Bull trend. This extremeness is also captured in the State of Market Report.

P.S. The trend is based on weekly time frame as of Friday  closing.
      Lev Buy and Lev Sell indicates leverage positioning.
      I have included price change with the color for the confirmation.


At last Indices in green; Bank Nifty in black now.

Indian indices Nifty and Bank Nifty ended in green and today started with gap up.
The shorts were covered at 5265and103000 levels. Bank Nifty which has been relatively bullish moved up a lot.

Now the question is should we go long.

Well there are no signs of going long untill we hold today's gap. The upside has resistance which are quite near.

The color of Bank Nifty is in Neutral from y'day on daily timeframe so that is the most bullish bet as of now.

Friday, February 11, 2011

Charting the Emerging Markets path

Emerging markets have been in focus a lot in this decade. They should be as the last decade returns have been spectacular. Tracking from 2003 onwards they have outperformed the SPX index by 3 times in returns.
Their ETF's are hugely popular in US with the key emerging market ETF being in top 10 in NYSE ETF.

Coming to Emerging Market ETF there are signs of weakness which should matter a lot at this juncture. The US index is hitting new highs so the investors as the buying more of their home equities which is getting reflected in the outflows in emerging markets.

The relative ratio chart:

The uptrend breakout in the ratio has come in 2011 just when the US equities has their one of the best January.

This is reflected in the chart of ETF in which the key signals are highlighted.


The top inside the bands in early Jan, increase in volumes on down days, crossover of 20 and 50 DMA and now break of lower band while bands are sloping down.

The support is at 44 levels which the ETF should hold for the bullishness to continue.
Just have a look at the key emerging market indices here. Follow up of the BRICS chart link here.


Only Taiwan and Russia are holding the 50 DMA as of now.


Why do we tend to go for the bias instead of searching the right direction?

I hope the heading does not put you off or make you think this could be a long discussion post.


What I mean is that some of my recent posts emphasized that the markets are at support levels like Nifty at 5250-5200 band, Bank Nifty at 10K levels, BSE500/Nifty ratio also at double bottom with bearishness at extreme. We booked partial short at 5250 and 10200 but the markets are still down. Though it was good that the other half is still there. But the color was Lev Sell for all the timeframes and there was not even 1% bounce back which could indicate any strength.


What I mean is that our search for bottom or support is it a bias or based on some true foundation?
When we try to predict the market how often it sets in our mind and our eye searches for confirmation only.
The charts and studies starts telling the same story which is revolving in our heads.

These are few points to ponder would appreciate if someone shares his insights.

Thursday, February 10, 2011

India X & O relative chart

The relative chart of BSE 500 Index and Nifty was flagging warning signals from late 2010. Any bullish rally should be reflected in broader market for it to continue.

Here is the chart of BSE 500 Index relative to Nifty which has been making lower tops in late 2010 with early Jan 2011 bottom break a perfect warning signal. This combined with lower tops was a perfect sign.

The ratio is now at critical support levels.


State of Market: New lows at extreme

Last State of Market report on 1st Feb (Link here) was about the increasing selling pressure with a little divergence.

In this edition the divergence is gone and the New lows has been increasing day by day.

First the liquid F&O stocks analysis. The color of the stocks indicate that the whole market has just one color which is red. The readings are:


These are new levels which are generally hit in bear market sell offs.

Going further to BSE 500 index the story is same.

The number of stocks below the 200 DMA are 90% which was 80% on 1st Feb. 

No respite here. Selloff is in the broad market also.
But this figure does not tell us completely if we have hit the oversold levels as the trend is towards bearishness so the broad market would follow also.

Same logic goes for RSI and macd also as in the bear phase the bands of the indicator changes and it would not be good to consider RSI below 30 as oversold.
Checking the New highs / New lows ratio for NSE exchange as whole:


So lets see the parameters based on the standard deviation of the price which is the best given the current circumstances.

As of now there are 61% of BSE 500 Index stocks trading below their 2 Standard Deviation price.

All of the above points to bearishness and for sure the change in larger trend to bearishness.


Wheat going higher and higher

Lat time I wrote about wheat in Egypt crisis post.

The commodity since then is making new highs and is at fresh 52 week highs.
It has been just 9 days since then and the commodity has moved up 8% since then. Good to know that kind of move especially when one is trading India which is making new lows now.

There are couple of global events and clomate factors behind this kind of move. Here is the chart:

India Futures 10 Feb: What after 5225?

Nifty and Bank Nifty futures have reached target of 5225 and 1000 levels. Post here.

The daily and weekly color is still Lev Sell so the shorts imitated at 5490 and 10600 are partial closed and the rest will be closed at proper exit signal.

The market is showing signs of extreme bearishness at these levels which can lead to some bounce or range mode since we cannot know when that happens the rest of shorts are continuing so that we should not be left out of any down move.

The Nifty index is still to show any sign of strength on hourly charts. The Bank Nifty though has shown signs of strength and is holding the levels of 10000.

Wednesday, February 9, 2011

Quanting India: Sensex Mean Reversion study

Markets display a very peculiar phenomenon called Mean reversion. Without this there the prices would be just random. See more on this concept at Wikipedia. Link here.

There can be multiple variations of this concept which are applied to markets. Like closing price relation to high or low etc.

One widely followed is the mean reversion to moving averages like 50, 100 and 200 day MA. There are already well defined trading strategies based on the price and the moving averages.

For today let us consider the 50 Simple Moving Average and Sensex. I am taking Sensex because it has longest price history in Indian indices so the strategies can be back tested well.

To look for mean reversion to 50 DMA lets plot the Sensex closing w.r.t 50 DMA.

We get the following chart:


There are few spikes but more or less the prices have stayed within a band. Doing the statistical analysis to the values we get the following:


The values are consistent with the bullish bias of Indian markets for last 30 years.
Going further I calculated the lows of the data set in the bull phase and high points in the bear phase. These values can tell us the probable points where the buying in done in bull and selling in bear phase. And this particular trade has the highest probability of success till our view of market phase is correct.

Well now how to trade with the above strategy at this point.
Looking at the extreme right hand side of the chart of last 2 years we can have some idea about the current setup. The ratio is at the lows of the bull run where generally the buying comes.


Does this indicate that buying can be done at this point. Well there is still no confirmation in the reversion strategy as of now as there are a few elements missing for triggering buy at these levels.

I will update in future posts if there is any indication in that respect.

The above post is meant for quant strategy discussion rather than any investment advice.


India futures update 9 Feb

Nifty has finally moved below 5300 levels and Bank Nifty near to 10000 levels.
All this looks really bad as markets are breaking all the supports and showing no signs of strength at any levels.

Well one should not fight rising ADX especially when it is above 30 levels. Two days back only I posted (link here) that the ADX is rising from below 20 levels and the trend is bearish. It was the same trade setup which occurred in Sep rally for markets.


For Bank Nifty the 10000 levels will be psychological and action at this level will be worth watching.

The Fibonacci projections for the current wave stands at 5220 levels and for Bank Nifty at 10000 and 9700 levels.

Tuesday, February 8, 2011

Hong kong going the indian way

Hong Kong index HSI has formation quite similar to Nifty charts of early Jan.

The HSI index has lower top formation with index struggling at key trendline support of the Sep rally. It is holding the 50 and 100 DMA for now. The 50 DMA though appears to be exhausted as it has been flat for last 1 month.
Keep any on the charts for now.


Old posts predicted the path. New labels

For today I will post the links of earlier emails which indicated the stand on Indian Markets.

Point & Figure: Target 5250

Nifty Color: Lev Sell triggered here.

Nifty 200 DMA break. Post here.

Weekly Sectoral Color: Link here.

State of Markets: No signs of buy.

For readers the old posts can be searched through the labels which can be found at the bottom of the blog.

Monday, February 7, 2011

Nifty IV and HV: Not painting good picture

Nifty IV and 10 Day Historical Volatility are above 20 levels.

Both of them staying above the average levels indicates the fear in market and is leading to lot of protection buying. This is evident in the PCR ratio and the Put build up at 5400 levels.

This high levels of volatility is only a recent event and does suggest some shift happening in market.


The Indian VIX is also trading at the upper range of last 6 months. The index has resistance at 25 levels if that is crossed then we can see more and more volatility with sudden reversals.

For all this the crucial level is 5320. ??????  Yeah 5320 as the average price of the 5400 puts is Rs 80  so put writers will be in loss at break of  (5400-80) = 5320 levels.

Watch any close below that.

India Sectoral Trend Weekly 4 Feb

There is no major change in trend in the Indian sectors. The main color remains red only.
Nifty itself was in Lev Sell mode last week and is still continuing the mode.

There are only 4 sectors among all which are still not in Lev Sell mode and only IT sector in Neutral or Buy mode.

The sectoral observations:

1. Auto index is now in Lev Sell mode after 2 weeks of sell mode.

2. The IT indices are now in Neutral for CNX IT and  Buy for BSE IT. The difference is due to there composition.

3. The BSE Teck index is now in Sell mode and the color is getting to red from last 3 weeks.

4. The major losers were FMCG, Realty, IT and Auto Index.

5. The Metal, Oil & Gas, PSU and Caps good being in Lev Sell mode were flat to +ive signalling to show divergence. Need to keep a watch on these indices.

P.S. The trend is based on weekly time frame as of Friday  closing.
      Lev Buy and Lev Sell indicates leverage positioning.
      I have included price change with the color for the confirmation.


India futures: Rising ADX not good

Nifty has rising ADX at 33 levels with bearish DMI. This has never been a good sign as the indicator has high success rate given that it is rising from below 20 levels.

The index has closed below the lower bollinger band thrice in 2011 with last friday the latest. Also there is crossover of 20 and 200 SMA on daily charts.

The futures are still in bearish zone after the shorts added at 5490 levels and 10600 levels. Daily and weekly for both Nifty and Bank Nifty are in Lev sell mode.


Sunday, February 6, 2011

Tin: Where is it heading?

Tin a very less know metal is making new highs and has even crossed the 2008 peak. Only the chart.


Saturday, February 5, 2011

US Sectoral Trend: Energy momentum powering ahead

Looking at the US sectoral trend for year to date, XLE i.e. S&P energy ETF  has outperformed SPX by 4% and is best sector.
The other two sectors giving +ive returns were Technology (XLK) and Industrials (XLI).

The snow effect is visible in Cons Staples and Cons Disc sectors as they were under performer by 4% and 2%.

The Utilities has been down for quiet some time. Financials which were leading are now performing in line.


Worth noting is the consistent leadership of Energy sector for last 6 months. There is a momentum theory in play here.


Friday, February 4, 2011

What happened to markets? Did we miss anything?

What a sell off, looks like someone exited India in a big way.

We were Neutral in morning but added shorts at break of 5490 levels which was the trigger for larger sell off.
The daily and weekly being still in Lev Sell any slight short opportunity can be taken to enter the market.


Meantime look at the post here and here. These all are long term signals which were posted quite earlier.


Nifty: Are we out of zone now

Nifty moved up nicely after the short covering call. Rest of the shorts were also covered at 5500 levels.

So are we heading to bullish area now. Well that's worth waiting. Bank nifty is already in reduced buy mode with Nifty in Neutral mode.


The upside resistance for trading purposes is at 10900 and 5600 levels.  Bank Nifty coming out of bearish zone faster than Nifty shows its bullish relative strength. If the strength continues than it would be better to take bullish view in Bank Nifty.

Better to be in Neutral/reduced buy at this stage as bullish confirmation is still not there.

Thursday, February 3, 2011

Dow Theory: Sign of caution or Crude effect

The latest signal from Dow theory is of caution. The last sign was of bullishness when Indu was at 11250 levels. Post here.

Now the Transports has broken the 50 DMA and has last swing high below 50 DMA while the Industrials INDU is trading above the 50 DMA. Chart:

While this could be the effect of crude as Transport companies use crude as their primary input and is there main cost. If crude stays above 90 levels then for sure it could have some effect on the Industrial index also as crude is used in every aspect of life which could for sure increase the inflation. More discussion can lead to debate here.So lets see charts.

The second way we can look at this is that divergence can be a buying point for Transports as Industrials is still at new highs. For that lets see how the broader US indices are telling us.

Not much of signs of caution in Midcap and smallcap indices.

Crude has moved to new highs though failed to cross the resistance there. The structure is still bullish of crude.

This all could be attributed to Egypt effect which lead to fresh highs in commodities. Reuters commodities index CRB broke to fresh weekly highs. Link here.

Futures showing divergence: Time for partial profits

Nifty and Bank Nifty are showing multiple divergences at these levels. The support of 5400 was held for second time in a row and Bank Nifty again showed strength compared to any other sector.

While daily color still being Lev Sell, I feel that some partial profits can be booked at these levels and let some shorts run which can be exited at proper signal. Nifty 5465 and Bank Nifty at 10570.

Shorts can further be added if we break today low. It is the last legs of wave at support levels get tricky. Its the same at 5640 getting repeated at 5400.

Wednesday, February 2, 2011

India: Analysing January effect on year

January barometer is most discussed for predicting the year end returns for any index.

Lets analyze the January effect on Indian markets. Although the Sensex does not century old data so that we can draw some conclusion with large set of numbers so lets see whatever we can find out with the 30 years of data.

The preliminarily data shows correlation of 0.23 with R square at 0.054 which is quite weak for making any direct statistical analysis. This is evident from the following chart also. There are large number of outliers from the linear trendline.


Going further lets apply some filters and see if we can good data coorealtions. The first filter can be of bands of price change and then finding the probability. Following is the analysis:

The probability of  having a bullish year for a negative January is at 62% which is quite high. But wait.

The last 2 rows shows show the returns with price filters. And both of them have very less probability of bullish year.
The Jan 2011 had -11% returns so the last row shows bullish year has chances of 25% with average change of last occurrences at -11% which is quite bearish figure.


Nifty Bank Nifty update 2 Feb

The gap up opening today is very much part of the high volatility and the key support of 5400 levels for Nifty. Holding 5400 is the life line for bulls.

This being the first gap up in the downtrend will be crucial future direction decider. This is best point to know the strength of sellers as they get a real good point to sell where the bulls have head start. Worth watching the action.

Today partial shorts can be cut at 5515 levels for Nifty and 10700 levels for Bank Nifty. The daily color is still Lev Sell.


Worth noting is the recent out performance by Banks w.r.t other heavy weights.

Color charts.

Tuesday, February 1, 2011

Egypt effect in charts

Lets see the effect of Egypt in charts.

First Egypt index. There is 20% staright fall in just 1 week.


Now the commodities. CRB Index broke out and is now at 52 Week highs.
Most important if we look at what are major commodities Egypt trades, there are two main: Oil export and Wheat import.

Oil everyone knows so here is the chart of wheat. This particular commodity is up because whole of middle east imports it and the last thing they would want is food riots.

State of Market 1 Feb: Breadth is at extreme lows: No signs of buy now

State of Market report tries to capture the pulse of broad market by analyzing the stocks and other factors of market breadth. The previous issue was about the stocks diversion from 200 DMA and the breadth did pulled Nifty below 200 DMA. Link here.

The bearishness still remains at extreme though some divergence is there at the lows today. Analyzing the stocks color with last report.


Worth noting is that Markets have come down but the breadth slightly has improved since 19 Jan as seen above.

This kind of divergence generally happens in the last leg of fall although this can keep on changing, so no perfect conclusion can be drawn fro this alone. Since the above stocks are liquid ones lets see the broader market picture if there is any such divergence.

The broad market index BSE 500 does not show any kind of divergence. BSE 500 stocks vs 200 DMA.

The stocks below 200 DMA has now increased to 80%, earlier it was 67%.


Going further let me analyze  the New high and New lows and the Advance Decline graph for NSE as a whole.
 While the new highs are getting less and less the new lows are increasing. There is no divergence on that chart as well.
The Advance Decline line is downward sloping one suggesting the selling pressure is huge at every highs.