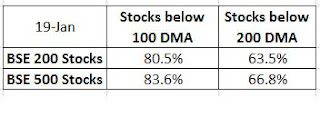
The bearishness now is at extreme as a very high %age of the stocks are in sell mode. Table below:
The ratio of buy and sell %ages are at extreme for last 6 months which shows deep oversold levels in the not only for the index but also for the breadth of the market.
We can for sure see some rally from here which can correct this over sold levels.
Taking stock of the market breadth from BSE 200 and BSE 500 stocks.
I tried to calculate the number of stocks below 100 and 200 DMA for the above indices. The results:
Stocks of BSE 500 below 100 DMA is more than BSE 200 Index for both the 100 and 200 DMA count. This indicates the sell off was more in midcap & small cap stocks.
Worth noting is the # of stocks below 200 DMA which is higher than 50% while Nifty has still not broken the 200 DMA. What it means? As per my understanding it shows that the market can bounce very strongly as Nifty is staying above the 200 DMA and this can sure trigger some buying in mid cap stocks.
Do write back with ur interpretions.


No comments:
Post a Comment