Showing posts with label Bank Nifty. Show all posts

Wednesday, May 11, 2011

Nifty Trend Indicator with multi timeframe update

Nifty Trend indicator with 4 Hour timeframe


There are times when there is no clear trend in the index. This generally happens when the short term and longer time frame trades are not on the same page or the traders and investors are thinking differently about the markets.

The ongoing week is one such period in the market. The above conditions can be detected very easily with a trend indicator and using it on higher timeframe.

For example: The following chart shows the Trend for both 1 Hour and  4 Hour time frames.


The hourly trend shows traders activity while the half day (4 Hour) timeframe shows large investors take on the markets.

Right now the 1 Hour Trend is in Buy mode while the 4 Hour is in still Sell mode.
Perfect recipe for confusion and that's pretty much evident also as the Index is seeing buy form lows while the rallies are being faded out.

Related Post:  Trend indicator with multi time frame

Friday, April 29, 2011

India futures color change to Sell

Nifty color changed to sell mode at today's open and the Bank Nifty also changed to daily sell mode.


The weekly color is still buy for Nifty and Bank Nifty but the reversal trendline is very close at 5700 and 11200 for Bank Nifty.

Thursday, February 24, 2011

India futures: Break of range trading possible

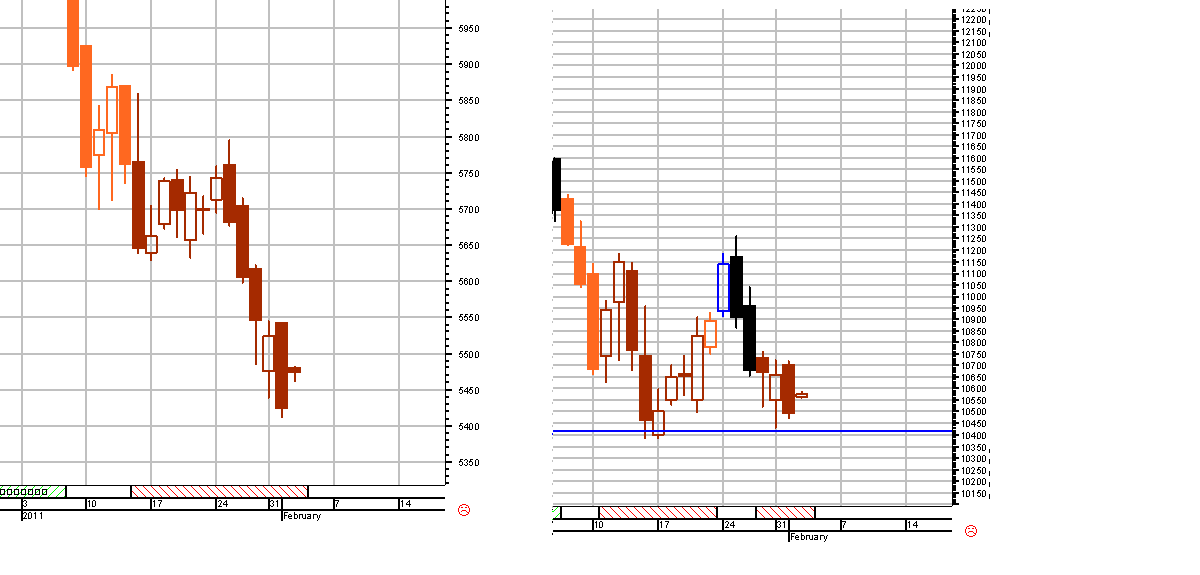
Indian indices are trading within range for last 4-5 days with narrow range and inside day formation at the middle ground of bulls and bears.
The index has given many whipsaws in trading which is key feature of range trading.

The 120 min bollinger band has been a good indicator to trade during this range period.. Will update about that later on in detail.

The daily colors are still neutral as of now but can come sell on break of range of 5400 and 10700 for Nifty and Bank Nifty.

Best would be stay light and learn something new.

Friday, February 18, 2011

Nifty Bank Nifty non stop rally

The Indian Indices Nifty and Bank Nifty has rallied for last 6 days. We had longs from 5375 and 10400 levels. See the post here yourself. What a rally.

The Bank Nifty and Nifty are now in proper buy signals.

This kind of rally is always expected when the street sentiment is so skewed to one side move and the move always happens in the opposite direction. In the earlier post we made that sentiment call.

What now.  Well, Indices closing in green for last consecutive 5 days with the best ever breadth of recent times. This combined with no down ticks at the crucial mid band mean reversion point is bullish sign.
The index has held the earlier upside gap with one formed today so it surely seems that the current wave has way to go.
The next logical resistance is the 200 DMA at 5625/5630 levels and the Fibonacci resistance at 5610 levels could be possible profit taking points although watch for down ticks there.

Monday, February 14, 2011

At last Indices in green; Bank Nifty in black now.

Indian indices Nifty and Bank Nifty ended in green and today started with gap up.
The shorts were covered at 5265and103000 levels. Bank Nifty which has been relatively bullish moved up a lot.

Now the question is should we go long.

Well there are no signs of going long untill we hold today's gap. The upside has resistance which are quite near.

The color of Bank Nifty is in Neutral from y'day on daily timeframe so that is the most bullish bet as of now.

Thursday, February 10, 2011

India Futures 10 Feb: What after 5225?

Nifty and Bank Nifty futures have reached target of 5225 and 1000 levels. Post here.

The daily and weekly color is still Lev Sell so the shorts imitated at 5490 and 10600 are partial closed and the rest will be closed at proper exit signal.

The market is showing signs of extreme bearishness at these levels which can lead to some bounce or range mode since we cannot know when that happens the rest of shorts are continuing so that we should not be left out of any down move.

The Nifty index is still to show any sign of strength on hourly charts. The Bank Nifty though has shown signs of strength and is holding the levels of 10000.

Monday, February 7, 2011

India futures: Rising ADX not good

Nifty has rising ADX at 33 levels with bearish DMI. This has never been a good sign as the indicator has high success rate given that it is rising from below 20 levels.

The index has closed below the lower bollinger band thrice in 2011 with last friday the latest. Also there is crossover of 20 and 200 SMA on daily charts.

The futures are still in bearish zone after the shorts added at 5490 levels and 10600 levels. Daily and weekly for both Nifty and Bank Nifty are in Lev sell mode.


Friday, February 4, 2011

Nifty: Are we out of zone now

Nifty moved up nicely after the short covering call. Rest of the shorts were also covered at 5500 levels.

So are we heading to bullish area now. Well that's worth waiting. Bank nifty is already in reduced buy mode with Nifty in Neutral mode.


The upside resistance for trading purposes is at 10900 and 5600 levels.  Bank Nifty coming out of bearish zone faster than Nifty shows its bullish relative strength. If the strength continues than it would be better to take bullish view in Bank Nifty.

Better to be in Neutral/reduced buy at this stage as bullish confirmation is still not there.

Thursday, February 3, 2011

Futures showing divergence: Time for partial profits

Nifty and Bank Nifty are showing multiple divergences at these levels. The support of 5400 was held for second time in a row and Bank Nifty again showed strength compared to any other sector.

While daily color still being Lev Sell, I feel that some partial profits can be booked at these levels and let some shorts run which can be exited at proper signal. Nifty 5465 and Bank Nifty at 10570.

Shorts can further be added if we break today low. It is the last legs of wave at support levels get tricky. Its the same at 5640 getting repeated at 5400.

Wednesday, February 2, 2011

Nifty Bank Nifty update 2 Feb

The gap up opening today is very much part of the high volatility and the key support of 5400 levels for Nifty. Holding 5400 is the life line for bulls.

This being the first gap up in the downtrend will be crucial future direction decider. This is best point to know the strength of sellers as they get a real good point to sell where the bulls have head start. Worth watching the action.

Today partial shorts can be cut at 5515 levels for Nifty and 10700 levels for Bank Nifty. The daily color is still Lev Sell.


Worth noting is the recent out performance by Banks w.r.t other heavy weights.

Color charts.

Tuesday, January 25, 2011

Color of Major 25 jan

There has some change in the color of Major Movers recently.

Here is the update view:

The main change is the Nifty coming to sell mode in both time frames while Bank Nifty after crossing the 11100 levels is now in Buy mode on daily charts. The hourly trend was reduced buy from 10850 levels itself. Post here.

Nifty is also quite close to the reversal levels of 5900 on daily charts while it will be reduced buy at 5800 levels on hourly charts.

Monday, January 24, 2011

India Nifty Bank Nifty update 24 Jan

Bank Nifty has recovered and is now above the 10750 levels crucial for bullishness on hourly charts.
The index though is in Sell mode on daily (but will be neutral above 11000 levels) which makes it a reduced buy only above 10750 levels.

Nifty has given a lot of whipsaws last week and the index had a flat close on weekly basis.
The shorts was stopped out on Thursday and Friday with no gains indicating more range bound movement going ahead. The upside resistance is at 5800 levels with support at 5640 levels.

Bank Nifty hourly signal with Nifty channels.


Friday, January 21, 2011

Futures update 21 Jan

Nifty and Bank Nifty trade was stopped out at 5710 and 10650 levels y'day and now both the indices are in neutral trading zone. The support was perfect when the market moved with volumes at crucial levels of 5640. Though I expected the volumes for the downside but its The Market.
The fact that short trades are not making money for last 3-4 days itself indicates that the short trade could be over for sometime.

Long possibilities for Nifty above the previous high of 5765 and for Bank Nifty above y'days high of 10900 levels.

If you would have looked at y'days Nifty channel chart there was sideways channel formation for this week on hourly chart. This happens when the Index is at support levels and making base for a large move.

Thursday, January 20, 2011

Bank Nifty: System Testing Trend Defining Line

Last month I wrote about a simple concept of buying and selling based on a buying and selling on cross of a simple trend line. Post here.

Then I tested the Nifty daily data of last 15 years and the system was outperforming the buy and hold. Post here.

Today I am testing the same concept for Bank Nifty on weekly charts. The main reason I am testing on weekly instead of daily charts is that the Bank Nifty being a high beta index has more whipsaws on daily charts and the test conditions being very simple it generates a lot of trades some even by just 2 points lower close.

Also there are always different system performing well on different timeframes and we should always trade them in that very timeframe for maximum advantage.

Please see this post as an endeavor to quantifying some technical strategies and then optimize them for better trading results.

Lets look at the results:

Buy & Hold out performance: 54%
Profit Factor (Profit/ Loss):      5.3
Absolute Drawdown:              513 points

Time frame: Daily for last 10 years on Bank Nifty spot.

Buy Condition: Close above the TDL.
Sell Condition: Close below TDL

Short Condition: Close below TDL
Profit Book Condition:  Close above the TDL.

Commissions: 0.10% of trade.
Trade Entry: Buy/Sell on next open bar i.e. if signal is generated before today's close then buy/sell tomorrow open. This is to have a realistic results and avoids preempting the signal though we loose a lot by waiting for next candle.

As can be seen these are very simple rules to trade.

Output

Equity curve is attached.

* CNX BANK INDEX (70001968)
Simulation Date 20/01/2011 12:17:04 PM 577 Weekly Bars 07/01/2000 Through 19/01/2011 (4030 Days)
Points Only Test
Performance
Profit 14724.5876 Pts
Performance N/A
Annualized Performance N/A
Buy & Hold Profit 9559.2855 Pts
Buy & Hold Performance N/A
Buy & Hold Annualized Performance N/A

Trade Summary
Total Trades 31
Trade Efficiency -3.59 %
Average Profit/Average Loss N/A


Profitable Trades
Total 15
Long 10
Short 5


Average Profit 1206.4348 Pts
Highest Profit 3907.3321 Pts
Lowest Profit 32.2313 Pts
Most Consecutive 2


Unprofitable Trades
Total 16
Long 5
Short 11


Average Loss -210.7459 Pts
Highest Loss -830.6802 Pts
Lowest Loss -25.8716 Pts
Most Consecutive 5


Maximum Position Excursions
Long Favorable 5257.9317 Pts
Short Favorable 4073.1338 Pts
Long Adverse -931.1746 Pts
Short Adverse -958.5298 Pts


Trade Efficiency
Average Entry 60.11 %
Average Exit 36.30 %
Average Total -3.59 %


Average Long Entry 71.38 %
Average Long Exit 42.19 %
Average Long Total 13.57 %


Average Short Entry 49.54 %
Average Short Exit 30.78 %
Average Short Total -19.69 %
Performance Indices
Buy & Hold Index 54.03 %
Profit/Loss Index 81.37 %
Reward/Risk Index 96.63 %

Accounting
Initial Equity 0.0000 Pts
Trade Profit 18096.5213 Pts
Trade Loss -3371.9338 Pts
Commissions 115.0702 Pts
Interest Credited 0.0000 Pts
Interest Charged 0.0000 Pts
Final Equity 14724.5876 Pts
Open Positions 0.0000 Pts


Account Variation
Highest Account Balance 15565.2663 Pts
Lowest Account Balance -513.0161 Pts
Highest Portfolio Value 5257.9317 Pts
Highest Open Drawdown -513.0161 Pts
Highest Closed Drawdown -461.0274 Pts


Account Events
Margin Calls 0
Overdrafts 0


Profitable Timing
Average Trade Length 30
Longest Trade Length 76
Shortest Trade Length 5
Total Trade Length 451


Unprofitable Timing
Average Trade Length 6
Longest Trade Length 21
Shortest Trade Length 1
Total Trade Length 104


Out of Market Timing
Average 7
Longest 21
Total 22

India Futures update 20 Jan

Nifty and Bank Nifty gave a sell signal y'day and they gapped down today.
This sell signal assumes more significance as the Daily signal for both the indices is in sell mode.

For Nifty the support is at 5650 and Bank Nifty at 10450 levels. Since Nifty has not broken the 5650 levels any close below that level today will be a bearish sign and more selling can follow on.
Watch the volumes at 5650 as last two days were of low volumes rise so if volume increases today it can be of great significance otherwise we can see one more shallow rise in Indices.

Reliance: The stock was in sell color  from 17 Jan. Post here.

Hourly charts:


Wednesday, January 19, 2011

Nifty Bank Nifty futures 19 Jan

The hourly charts of the futures are in neutral mode. The opening was expected to be good but what matters for bullishness is the strength above y'days high of 5745 and 10700 levels as mentioned here.

On the downside since there is higher bottom formation can look for support at 5650 and 10450 levels. Any break of that will be trigger bearishness as Daily charts are still in sell mode.


Tuesday, January 18, 2011

Nifty Bank Nifty update 18 Jan

Y'day the futures were in a tight range with indices at levels where the declines get over in Bull phase.

Trading can be volatile here so any new postions in profit should be partially booked as we hit supports/resistances.


The high of y'day at 5704 can be regarded as first resistance and 75% of potions should be booked at 5710 with closure of shorts at 5750.

For Bank Nifty the first profit booking level is 10600 and then shorts closure levels is 10750.

Generally the last leg of any move is the most difficult to capture and profit as it is swift and volatile. And we are seeing high volatility with long wicks on candles for last 2-3 days.

Monday, January 17, 2011

Color of Major Movers 17 Jan

The major movers continues to be in Sell mode from last week. Last week's post here.

The main change is Nifty and Ban Nifty came to daily Lev Sell mode on break of 5850 and 11000 levels.

This time let me also post the Nifty and Bank Nifty daily charts.

The chart is does not looks that good as I made it in a hurry. Will do a good job next time.

Friday, January 14, 2011

Nifty Bank Nifty hourly update 14 Jan

Today for the update I am attaching the hourly charts which need to be seen with the daily color update I posted y'day.


See the color change and being in daily sell mode the shorts started.

Thursday, January 13, 2011

Color of market: India Futures still on weak footings

A lot has changed is last 4 days after the last report on the Color of the Major players.

The following color matters a lot as it provides the positioning that is fed into the hourly charts for the trading purpose. These results can be used as standalone basis for the major moves to play.

Do compare this with the last post on the market major color here.

Nifty has come to sell mode on breach of 5980 on weekly.
Reliance closed below the key levels for 1030 and is now in sell mode.
CNX IT and closed below the 7200 levels and now the reversal to buy level is 7300.

Bank Nifty has been consistently in sell mode but now the levels are reduced to 11300 levels.