Showing posts with label World Indices. Show all posts

Tuesday, May 10, 2011

Strategy What happens when QE2 ends Part 1

The QE2 has been supporting markets a lot when it started in Nov 2010. The global markets made a fresh after that. The program is going to end in June 2011 and probably that's why the global markets  are changing their trends.

 In next few posts I will try to explore how to benefit from the upcoming macro event.

First lets see define the timelines

QE1 Start :  Jan 2009        QE1 End : Mar 2010

Ben Speech on QE2 Aug 2010  --> Indication on starting another round of QE.

QE2 Start : Nov 2010   QE2 End: June 2011

Everyone knows that the QE1 ended a bear phase and started bull run and most of global markets made highs in Jan 2010.

Most of the markets struggled during the QE1 end to start of QE2 period.

Attached is the chart with SPX and EEM with timelines.


The above chart clearly shows all the trend for US and Emerging markets.

Worth noticing is the markets show jitters 1 month before end of QE as it is unwinding of trades based on QE.

And I feel that the recent free fall in commodities was more or less attributed to end of QE2.
The increase of margins just added fuel to fire. The effect is clearly visible on CRB index charts.


So there is increased probability that when Fed withdraws the "Helicopter Printing Press"   (Visually)  then we can see a range market for quite some time.

Thursday, April 7, 2011

Nifty the same old pattern playing again

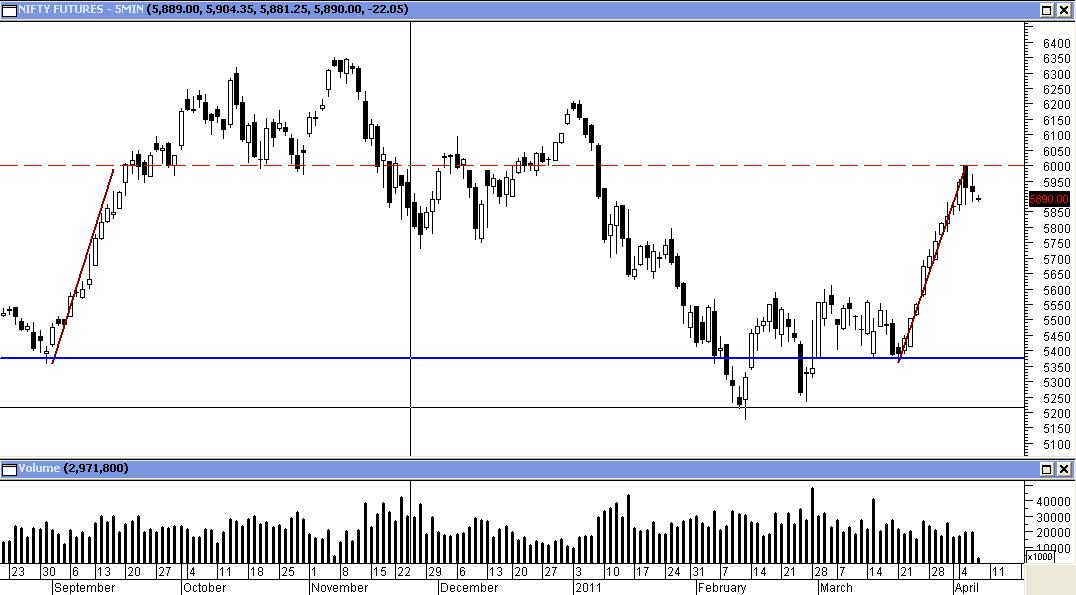
In the earlier posts there was indication that we can see a Sep 2010 kind of steep rally.  Post 1 and Post 2.

Well that came true and Nifty came to striking distance of 6000 levels and has a 10% upmove and we captured about 7-8% of that move.

What from here? That's a good question and many are questioning the move and many more are searching for direction.

First lets see a chart comparing the Sep 2010 and the present move.


Both rallies had same starting point at 5350 and the same exhaustion  at 6000 levels.

Analyzing further the number of bullish days are 11 and 10. The consolidation days at 5950 were 8 for Sep rally. This time the rally had 3 days as of now.

The index though has one bearish setup of bearish divergence and that also at trendline resistance from last 2 tops at Oct and Dec. But seeing Hing Kong index breaking out from such a similar setup the bullish options are open. HSI chart:


The recent volume action in Midcap and small cap index with better A/D across broader market weighs higher for bullish options.

Monday, April 4, 2011

EEM: Emerging Markets new high of 2011

Emerging markets etf EEM has made a new high of 2011 and has broken out of band of 48 and 44 levels.

The breakout has come with bullish gaps and above average volumes which is a bullish sign. The range gives a target price of 52 levels.

Worth noting is the recent uptick in the relative performance with SPX index.

Chart:


Earlier post on EEM
Charting the Emerging Markets path

Thursday, March 31, 2011

US Small cap makes new high: Bullish indication

US Small cap index Russell 200 has made a new high for the year 2011.
This is a significant development as the major index SPX and Indu are still below their yearly highs.
The small cap index is generally regarded as leading index and its turning up is shows investors confidence in the markets.

Attached is the chart:


Tuesday, March 8, 2011

Nifty IV moving higher

Nifty IVs cooled down after the budget and from the last update on 26th Feb. The current IV is higher than the 30 Day and 60 Day HV's.


The IV are not only higher than average but also highest among major stock indices of the world. Here the snapshot:

Worth noting is that the 1 month IV for the Asian Indices are higher than the 3 month IV's.

Looks like funds are bearish for near term but see the indices bullish for next 3 months.

Friday, February 11, 2011

Charting the Emerging Markets path

Emerging markets have been in focus a lot in this decade. They should be as the last decade returns have been spectacular. Tracking from 2003 onwards they have outperformed the SPX index by 3 times in returns.
Their ETF's are hugely popular in US with the key emerging market ETF being in top 10 in NYSE ETF.

Coming to Emerging Market ETF there are signs of weakness which should matter a lot at this juncture. The US index is hitting new highs so the investors as the buying more of their home equities which is getting reflected in the outflows in emerging markets.

The relative ratio chart:

The uptrend breakout in the ratio has come in 2011 just when the US equities has their one of the best January.

This is reflected in the chart of ETF in which the key signals are highlighted.


The top inside the bands in early Jan, increase in volumes on down days, crossover of 20 and 50 DMA and now break of lower band while bands are sloping down.

The support is at 44 levels which the ETF should hold for the bullishness to continue.
Just have a look at the key emerging market indices here. Follow up of the BRICS chart link here.


Only Taiwan and Russia are holding the 50 DMA as of now.


Tuesday, February 8, 2011

Hong kong going the indian way

Hong Kong index HSI has formation quite similar to Nifty charts of early Jan.

The HSI index has lower top formation with index struggling at key trendline support of the Sep rally. It is holding the 50 and 100 DMA for now. The 50 DMA though appears to be exhausted as it has been flat for last 1 month.
Keep any on the charts for now.