In the earlier posts there was indication that we can see a Sep 2010 kind of steep rally. Post 1 and Post 2.
Well that came true and Nifty came to striking distance of 6000 levels and has a 10% upmove and we captured about 7-8% of that move.
What from here? That's a good question and many are questioning the move and many more are searching for direction.
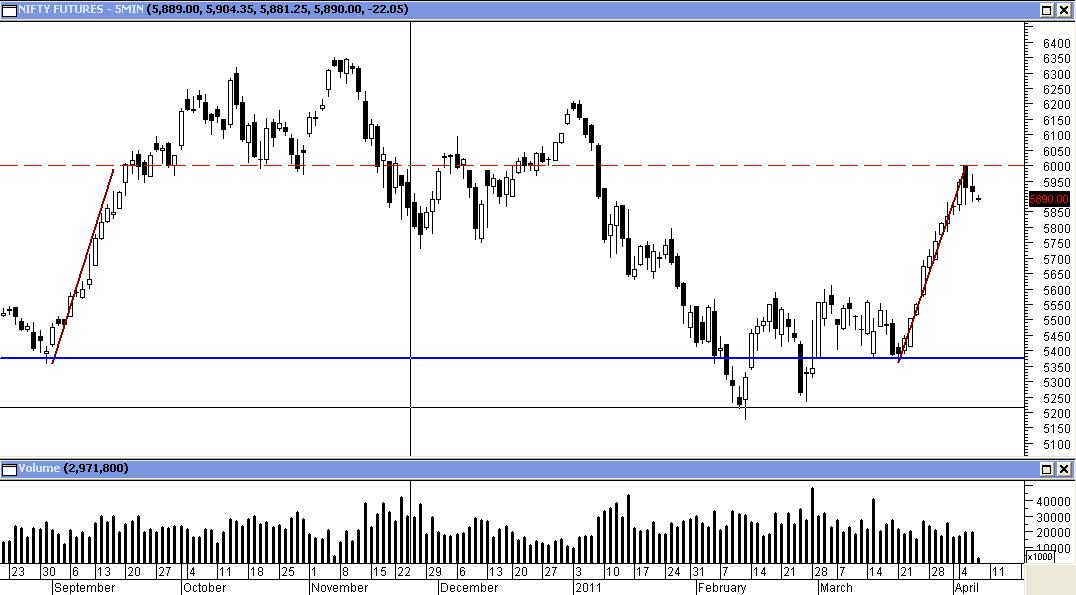
First lets see a chart comparing the Sep 2010 and the present move.

Both rallies had same starting point at 5350 and the same exhaustion at 6000 levels.
Analyzing further the number of bullish days are 11 and 10. The consolidation days at 5950 were 8 for Sep rally. This time the rally had 3 days as of now.
The index though has one bearish setup of bearish divergence and that also at trendline resistance from last 2 tops at Oct and Dec. But seeing Hing Kong index breaking out from such a similar setup the bullish options are open. HSI chart:

The recent volume action in Midcap and small cap index with better A/D across broader market weighs higher for bullish options.
Well that came true and Nifty came to striking distance of 6000 levels and has a 10% upmove and we captured about 7-8% of that move.
What from here? That's a good question and many are questioning the move and many more are searching for direction.
First lets see a chart comparing the Sep 2010 and the present move.
Both rallies had same starting point at 5350 and the same exhaustion at 6000 levels.
Analyzing further the number of bullish days are 11 and 10. The consolidation days at 5950 were 8 for Sep rally. This time the rally had 3 days as of now.
The index though has one bearish setup of bearish divergence and that also at trendline resistance from last 2 tops at Oct and Dec. But seeing Hing Kong index breaking out from such a similar setup the bullish options are open. HSI chart:

The recent volume action in Midcap and small cap index with better A/D across broader market weighs higher for bullish options.
No comments:
Post a Comment