Sunday, July 6, 2014

Budget Analysis: CNX500 Gainers from 30 May 2014 lows

Nifty index made low of 7118 on 30 May 2014 and gained 7% to close at 7751 on 4 Jul 2014.

Budget is on 10th July and the gainers and losers from our CNX500 constituents can give us insights into budget expectations.
Also it will tell us what is powering the current rally.


1.  From Top 50, Textile sector has 6 stocks with Welspun, Alok Ind, Trident gaining about 45%. Textile stocks as a whole gained around 27%. 
     Textile stocks always gain before Budget but this time the gain is unusually high as are expectations.

2. Construction and Automobile stocks are second highest gainers with 5 stocks each. Worth noticing is that Auto sector gainers are ancillary component manufactures. TVS is major gainers with 31% gain. For Construction sector the stocks have good fundamentals like D/E like Orbit and HCC.

3. Financial Services sector has 4 stocks which are NBFC. Worth noticing is that SREI and PTC are top gainers which are Infra sector lenders. MOSL a brokerage has a lot of plans as it intend to enter Housing sector lending. No major Bank is top 10 Financial sector gainer. Have they rallied too much?

4. Industrial Manufacturing stocks have also gained considerably with 4 stocks.

5. Last major sector is Chemicals with 3 stocks. There are some major expectations from Budget for this sector.

Worth noticing is there are no IT, FMCG and Pharma stocks. Also missing are large Banks which have powered rally till now.

So there seems to be high expectations from Textiles, Construction, Auto and Manufacturing sector and all of them are domestic and manpower intensive sectors.

Its good to note that there are no major expectations from Banks, IT and Pharma sector. These heavy weights if gain anything from budget then the rally can continue further.

Tuesday, July 5, 2011

Global Macro Strategy second half 2011: Inflation outlook

In the previous post we postulated some of the main factors which can dominate the second half of 2011.
The factors are:

1. QE3 or not?
2. Interest rates outlook for Emerging economies.
3. Will Fed hike the rates in 2H 2011?
4. The persistent European problem.
5. High levels of household debt and
6. Double dip or not....


Lets have a discussion about how each one of the above will affect the undercurrents of the markets.


As of now Fed has said that they are not doing any QE3 and I am sure they will not start any other money printing  program by the name of QE3. The Fed is already buying the bonds from the proceeds of maturing securities. 
That amount is not much and is staggered so the impact will be minimal.


The dual target of Fed being Inflation and unemployment cannot be met through the QE program now. While launching the QE2 there were fears of Deflation which is why the Fed started the money press. Now the CPI is rising so much that the US has released crude from the Strategic Petroleum Reserves. 


About employment the Fed cannot do much as it grows with the GDP. Unless there is growth in real economy the will not be much employment. To grow an economy one needs policy and incentives which is job of an administration, any reserve bank cannot do much in that space. 


So we feel that there will not be any QE3 program unless the inflation gets tamed.


It is expected that Fed will start raising rates in 2nd Half 2011 but as of now there are no indication in that direction. In the last Monetary Policy assessment Ben said that he is looking for an extended period of low interest rates. It is through the low rates that the Fed can keep giving the stimulus to the economy. Although it is debatable as Japanese low rates have not stimulated their economy in any way. 
I feel that unless there is a pickup in GDP to above 3% for two quarters Fed will not raise rates.


The ECB meanwhile has given indications of raising rates again as there target is to control inflation rather than unemployment. 
Given the worries on sovereign scenario for many European countries it does not make a case for any steep increase in interest rates but another 25 bps cannot be ruled out as the German and France industry is in good shape.


The scenario is very different in the Emerging economies as some of them has already raised the rates as the fight against inflation is intensifying. India, Brazil, South Africa, Taiwan all have raised rates minimun of 3-4 times in past 1 year.


There are now talks from China and India that the interest rate rise might be over as Inflation is showing signs of peaking. I think that with crude down to $90 levels there can be for sure some cooling off signs in inflation. 
Vietnam has actually reduced their rates this weekend as the growth suffered a lot. 


What we can see is less raise in interest rate rise from here.


In short there is for sure signs of abating inflation as there is no QE from US and crude below $90 levels.
This can reduce pressure on Emerging economies not steepen the rates which can improve their GDP growth in next 3-4 months.


The developing countries on the other hand will raise rates esp ECB as they feel the inflation heat.


All this can reverse the money to EM stock markets which fled earlier this year on inflation outlook.


Rest in next part

Monday, July 4, 2011

India Macro Strategy Part 1: Factors to consider

India has under performed for the first half of 2011. The performance was one of the lowest among the emerging markets inline with Egypt, Vietnam and Brazil. While Egypt and Vietnam has there own specific internal issues Brazil is in same set as of India. The problems plaguing India are Inflation, Investment slowdown, Inaction by policy makers.

We have been bullish on consumption stocks namely the FMCG for the first half. The rationale was to be in defensive sector as the first mid cycle slowdown hits the global economy.

Before forming strategy lets outline the major factors to consider:

1. QE3 or not?
2. Interest rates outlook for Emerging economies.
3. Will Fed hike the rates in 2H 2011?
4. The persistent European problem.
5. High levels of household debt and
6. Double dip or not....

All of the above issues were there in Jan 2011 and we are still having the same issues. Structurally noting has changed expect that QE2 has ended and fed has not indicating of any further QE measures at least by in name,

The same set of problems are still in the global economy.

Coming to India the main issues we need to consider are:

1. Inflation.... will this Genie ever get into the bottle
2. Investment slow down across the sectors.
3. Inaction by Govt. on policy formulation.
4. GDP Growth concerns

The policy inaction on number of fronts has been the main concern for the India. Recent corruption scandals has impacted the county's image a big way. FDI like Posco has been in limbo for a long long time.

These are the factors we will consider to arrive at strategy for this half.
We will explore in detail each of the above factors in next post.


Monday, June 20, 2011

Nifty multi time frame trend: Strength of convergence

In my last post on trend indicator I mentioned that there is struggle between short term traders and long term investors which makes trading difficult as the range comes into play and trend gets erratic. Link here.

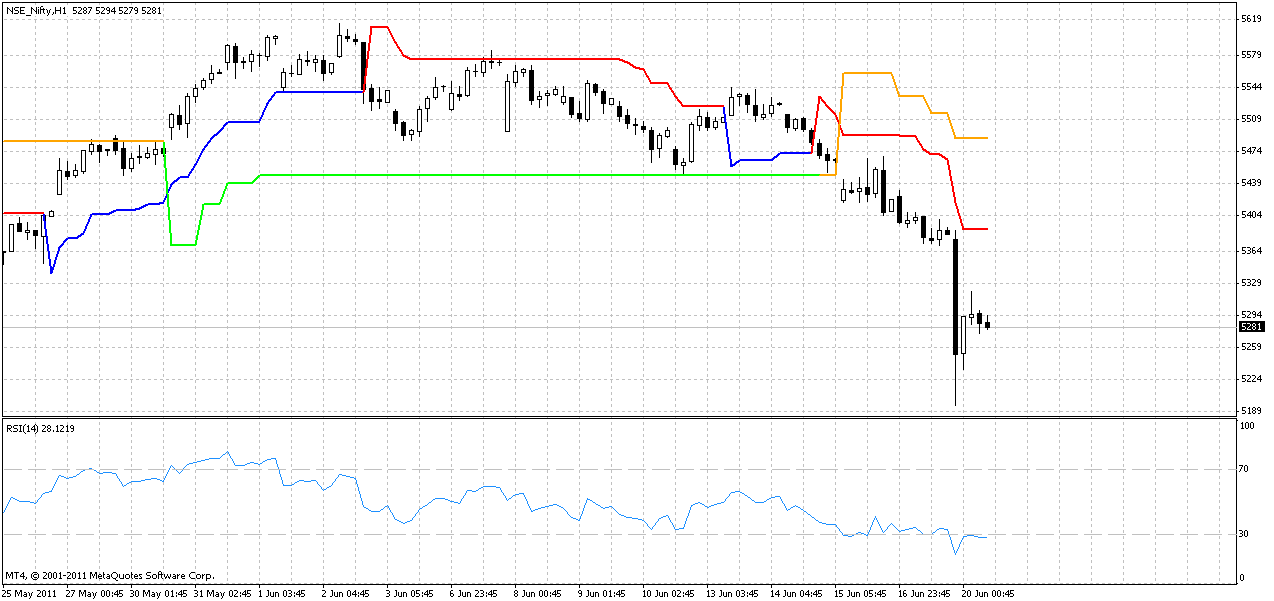
After that the Trend indicator gave a confirmed sell signal on both the Hourly and 4 Hour time frame. With that the last range was broken and RSI also shifted to bearishness as it broke the support of 30 levels.

Today the index declined 2% which came as surprise to many but our Trend indicator indicated quite early that trend is bearish now.  Attached is the chart.


Confluence of trend gives the best trading opportunity. 

Monday, June 13, 2011

SPX multtime frame trend chart

SPX has come to 1264 levels after breaking from the 1300 levels. We posted earlier that any break of 1300 levels can lead to straight fall. Link

The index has broken the first support of 1275 and is heading to 1250 levels.

In our multi time frame trend indicator we had a sell from 1330 levels. Attached is the chart.It shows how the bullish trend was captured and then the decline also. There were 2 whipsaws one long and one short. But the loss was not much. The trend followers look to capture the larger trend like the first bullish signal while keeping the losses minimized.


Tuesday, June 7, 2011

Nifty Trend multi time frame The fight of long and short term traders

Nifty has bearish trend activated from mid Friday and after touching the 5480 support the index is now flat.
The bearish hourly trend was of smaller duration.

Were there any indications of that happening? Yes there was.
The answer lies in the higher time frame trend. The 4 hour trend was bullish.

Whenever there is mis alignment of traders (short term) and investors (long term) the profitable trend is less.
It is there alignment also where trend is smooth and trade able.


Monday, June 6, 2011

SPX 1300 the line between Bulls and Bears

The SPX index closed just above the 1300 levels on Friday.  The candle was full body down with a negligible uptick from the lows. This shows the kind of pressure in selling.


The  last few attempts at 1300 were defended except for the sell off in March. And there is a very remarkable similarity between this and March's candle. Both were full body downsize candle. The other two attempts exhibited a bullish hammer at 1300 levels.


Will we break the 1300  levels this time and give a conclusive close below those levels?
Well the kind of candle does indicate sellers in control of the market with 3 consecutive bearish candles below the 50 SMA.

Any follow on below friday's low with bearish hourly candles is a sell opportunity.

Nifty Trend indicator in Sell mode

The trend indicator has turned to sell mode on Friday mid day.

The index turned down exactly from the 5600 levels which has been resistance for last 3 rimes.  This was the 4th touch and it has failed to take that level out which paints a very bearish picture. 

The buy from 5427 turned to sell at 5543 levels. 


Friday, June 3, 2011

Emerging Markets ETF

Emerging markets are generally regarded as the risker trade then the SPX. They are generally leading indicator of the change in the risk perceptions around the world.

The EEM etf is a good way to track the performance and perception about the emerging markets.

This etf has been in range for some time after breaking out from the resistance of 48 but then it reverted back to channel just when the commodity selloff started. This was also partially attributed to the QE2 end when risk reduction started globally.

The ETF now is holding the grounds quite well as it held the last range support of 45 and now has formed a falling wedge kind of pattern from where the breakout is happening.  The bullish breakout is confirmed above the 48 levels as it will be then above the range high.


Worth noting is the change in slope of relative performance w.r.t SPX.

Does this indicate the change in perception to risk especially when the US indices are falling?
As the emerging markets have both growth and domestic consumption not depend on US economy.

Thursday, June 2, 2011

Nifty Resistance still holds though picture is looking good

Nifty hit the old resistance at 5600 levels and saw gap down opening. Though the sell off was more news based but our charts predicted that the bull bear line at 5600 matters a lot.

The picture is bullish as the hourly trend indicator is still bullish as price is above the levels.

This is the third time 5600 is hit in last 1 month for Nifty and it has failed to cross. The next touch of 5600 will set the trend.

Nifty in hourly trend.


Tuesday, May 31, 2011

Macro Inflation Indicator Brazil's Bikini Wax

Today I read a beautiful article about how inflation is hurting people in their very social life. Link
The simplicity measuring inflation is these ways is far far better than putting all the surveys and collecting prices.

Summary: Brazil has one of the most beautiful beaches with year long summer so waxing far common. But the cost of waxing has increased a lot and is putting a lot of pressure on wages.

The country is facing very similiar prioblems like India and the central Bank over there has increased rates a lot and is also using currency as a tool to fight the inflation.

The stock markets looks very and has followed more or less same path.

Friday, May 27, 2011

US Sector Rotational Strategy XLE loosing leadership


US Sector Rotational Strategy XLE loosing leadership

Energy sector has been a favorite of this Bull Run and has been the outperformer among all the sectors.

That though is changing now as the relative strength of this sector has not only broken the uptrend but also has declining strength vs SPX now.

The new leaders are Consumer Durables, Staples and Utilities.


Thursday, May 26, 2011

Nifty Trend Multi time frame :

Please read the following post on the usage of Multi time frame at

Nifty Trend Indicator with multi timeframe update  which shows how the higher time frame trend can be used for better trading and trend detection.


Nifty index had a good selloff from last lat Apr onwards.

Have a look at the chart below which shows both the 4 hour and 1 hour trend.


Leverage could be increased on confirmation of the trend in both the timeframes.

Macro event trade: Wheat and Rice to gain


There is a drought condition in North China which is a major Wheat and Rice growing area. The drought is said to be worst in last 50 years. The first alert for the drought came in Feb 2011 when the rains were totally dry season.  What makes it worse is that China is world’s largest producer of Wheat.

The drought has come at the time of sowing season with very less of sowing season remaining now.
Since China has the world’s highest population it has many mouths to feed. This combined with the affluence of Chinese the per capita wheat consumption of China has increased a lot.


The wheat rallied to new highs in Feb and fell to supp[ort levels after that to 700 levels.


The commodity is trading in a range as of now but any further supply disruption can take it to new highs.

There are news of Ukraine starting wheat exports which can calm the markets for short term as of now.
But one can keep this commodity on the watch list for some time.


Thursday, May 12, 2011

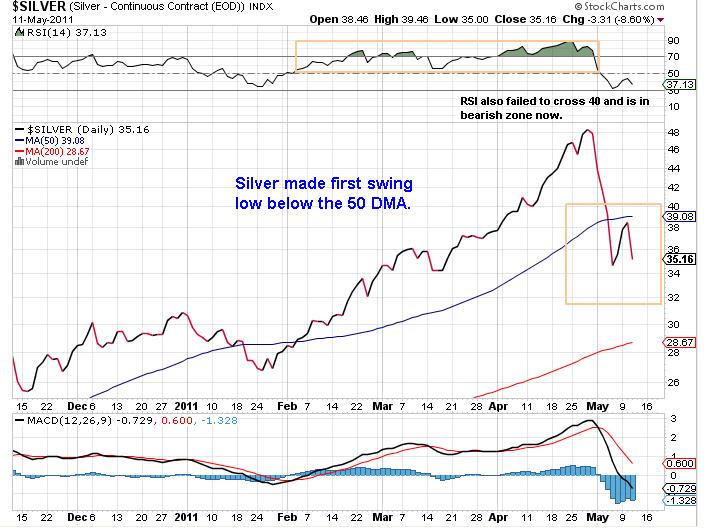
Silver Swing high below 50 DMA

Silver is making swing high below the 50 SMA.

The daily RSI has also failed to cross 50 levels and in now trading below 40 levels.


Nifty Color update and Bearish Setup

Nifty color on weekly has been on Sell mode from the start of the week. This coupled with the Daily Lev Sell mode is bearish for the index.

Nifty Inside Day and Narrow range setup:

If today Nifty closes below the 5520 levels then the index will break below the low of Inside day. The Inside day has high and lows within last day and is a sign of volatility contraction.
Also the Nifty daily range (High - Low) is lowest among last 7 days which is also a sign of volatility contraction.

So any break form this range can bring a one side move.  This setup when back tested gives a good result and the direction persists for next 3-5 days.


Wednesday, May 11, 2011

Nifty Trend Indicator with multi timeframe update

Nifty Trend indicator with 4 Hour timeframe


There are times when there is no clear trend in the index. This generally happens when the short term and longer time frame trades are not on the same page or the traders and investors are thinking differently about the markets.

The ongoing week is one such period in the market. The above conditions can be detected very easily with a trend indicator and using it on higher timeframe.

For example: The following chart shows the Trend for both 1 Hour and  4 Hour time frames.


The hourly trend shows traders activity while the half day (4 Hour) timeframe shows large investors take on the markets.

Right now the 1 Hour Trend is in Buy mode while the 4 Hour is in still Sell mode.
Perfect recipe for confusion and that's pretty much evident also as the Index is seeing buy form lows while the rallies are being faded out.

Related Post:  Trend indicator with multi time frame

Tuesday, May 10, 2011

Strategy What happens when QE2 ends Part 1

The QE2 has been supporting markets a lot when it started in Nov 2010. The global markets made a fresh after that. The program is going to end in June 2011 and probably that's why the global markets  are changing their trends.

 In next few posts I will try to explore how to benefit from the upcoming macro event.

First lets see define the timelines

QE1 Start :  Jan 2009        QE1 End : Mar 2010

Ben Speech on QE2 Aug 2010  --> Indication on starting another round of QE.

QE2 Start : Nov 2010   QE2 End: June 2011

Everyone knows that the QE1 ended a bear phase and started bull run and most of global markets made highs in Jan 2010.

Most of the markets struggled during the QE1 end to start of QE2 period.

Attached is the chart with SPX and EEM with timelines.


The above chart clearly shows all the trend for US and Emerging markets.

Worth noticing is the markets show jitters 1 month before end of QE as it is unwinding of trades based on QE.

And I feel that the recent free fall in commodities was more or less attributed to end of QE2.
The increase of margins just added fuel to fire. The effect is clearly visible on CRB index charts.


So there is increased probability that when Fed withdraws the "Helicopter Printing Press"   (Visually)  then we can see a range market for quite some time.

Monday, May 9, 2011

India Sectoral Trend Weekly 6 May

The last two weeks have been tumultuous for the equity markets.

With the straight fall there has been a lot of change in the weekly sectoral trend for the markets.
The main points are:

1. The # of sectors on Sell / Lev Sell mode is 10 with CNX IT Sector in Lev Sell mode for last 2 weeks.

2. Nifty was in Neutral mode as of Friday 6th May.

3. The trend for 11 sectors is Neutral which is quite high indicating the ongoing sideways movement in many indices.

4. Broader market indices like BSE 500, BSE Small Cap, BSE Mid cap and  Nifty CNX 100 are in Neutral zone.

5. The cyclical index Metal, Realty, Cap Goods and IT are in bearish mode while the defensive sectors are in Neutral mode.

The above points clearly shows that the trend is towards accumulating the consumption stocks rather than being in Growth or High beta stocks.

This is inline with the earlier Macro call of Monsoon trade. See Post here.

The weekly color table:


Thursday, May 5, 2011

Sensex: Quantifying Sell in May

There is a very famous investment philosophy to Sell in May and return in October.

Lets see how that strategy works for our Indian Markets.

The conditions are to Sell on first day in May and Buy on first day on October with commissions of 5 bps.
We are testing this from year 1980 and 2010 so that it covers most of the history available.

How are the results? Well, its not profitable. The initial equity of $10K got reduced to $9.8K while buy and hold was massively up by ~2 times.

Here's the snap shot of the performance.


There were only 10 profitable years among the 31 years of testing with the year 2010 contributed massively $4780  to the results.
The profits are completely skewed by a single year.

This clearly shows that the strategy is not profitable in itself but there was one profitable trend. That was the higher probability of a dip in early May which lasts for 2-3 weeks on an average.

Here's the equity graph.