Tuesday, April 12, 2011

Trend indicator with multi time frame

For quite some time I was working on a trend indicator. The trend is derived from high and lows with stop loss based on ATR. This is quite common and I just combined these two techniques.

Using highs and lows price as trend is reduces lag and the stop loss gets adjusted as per the volatility. The ATR is the one of the best indicator for gauging the volatility.

Now the major change I did was to use multi time frame indicator with base time frame. For example with 1 hour trend I use the 4 hour vales and then look for confirmation. When confirmation then its one side otherwise trade less.

A simple screenshot. The Blue line is 4 Hour indicator while the green and red is of 1 hour.


Trading based on multiple time frames is a good technique and can be quite useful in choppy markets.
The best use is to detect what is larger trend is and then position the trades based on that. The smaller timeframe then gives the entry point.

In the above chart the the profit booking sign came at 5850 and has been in sell mode based on 1 Hour time frame. The 4 Hour time frame indicator is still bullish with stop at 5750.

The strategy for traders would be to go short 50% at 5850 and then book profits at 5750. That is for short time frame traders and for institutional traders would be to go short on break of 5750 levels.

The same kind of strategy can be applied for any indicator. More on this particular indicator later.

Related Post:  Nifty Trend Indicator with multi timeframe update

Monday, April 11, 2011

Nifty IV and HV: Present Analysis

Nifty's HV of 10 days went below 10 and then rebounded. The HV (10 days) has been a good indicator for reversal from the top.


As can be seen the index reversed from the Jan top when HV (10) made a low below 10.
The HV (10) made 52 week low in July but the index did not fell sharply instead stayed in range abd broke out later.

This time the HV (10) moves below 10 with index also at trendline resistance. Nifty has surely seen given up 3% from the top as of now.
Analysing the HV of 30 days for Nifty though tells a different picture.


The chart shows HV(30) and IV's in a uprising channel which we discussed earlier also. Nifty IV moving higher. The difference of HV (30) and IV is less than 1 indicating mean values for them as IV seems to be optimally priced in.

The Nifty IV from last 2 weeks are consistently below 20 levels which on break of 20 can lead to one more burst higher.

As of now the options and IV's indicate more of range trading. For any breakout trades based on HV and IV one could watch the HV (10) cross of 15 and IV's move above 22 can be bearish for markets.

Related Posts.

Nifty IV's what are they foretelling


Friday, April 8, 2011

Copper: At Breakout levels

Copper is at major trendline resistance after bouncing from below 50 DMA.

The setup is very similar to Gold a few days ago which broke out from the triangle formation.

Copper being regarded as barometer of economy will be worth watching. The effect of Europe rate rise will surely reflect on this commodity as it is highly sensitive to economy growth.

Action worth watching:


Nifty Why so much confusion?

The markets are best place to get confused and its even better when everyone also is in same boat.

Well going by the Color system lets see what is the picture.

                Weekly --> Buy mode    |       Daily --> Lev Buy
          Start Value -->   5760          |       Start --> 5550

     Trendline System          Stop  -->      5800       ( Its not the normal trendline.Details)

If some can guide me on how to put these values on a different page on this website then I am glad to put the color, start and stop system for daily basis.


Thursday, April 7, 2011

Nifty the same old pattern playing again

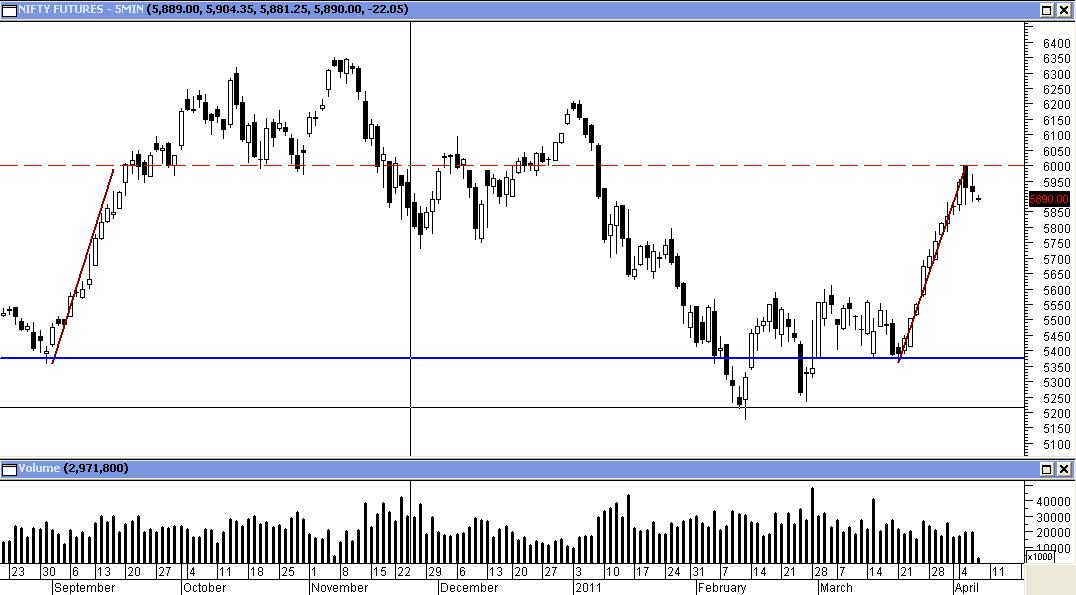
In the earlier posts there was indication that we can see a Sep 2010 kind of steep rally.  Post 1 and Post 2.

Well that came true and Nifty came to striking distance of 6000 levels and has a 10% upmove and we captured about 7-8% of that move.

What from here? That's a good question and many are questioning the move and many more are searching for direction.

First lets see a chart comparing the Sep 2010 and the present move.


Both rallies had same starting point at 5350 and the same exhaustion  at 6000 levels.

Analyzing further the number of bullish days are 11 and 10. The consolidation days at 5950 were 8 for Sep rally. This time the rally had 3 days as of now.

The index though has one bearish setup of bearish divergence and that also at trendline resistance from last 2 tops at Oct and Dec. But seeing Hing Kong index breaking out from such a similar setup the bullish options are open. HSI chart:


The recent volume action in Midcap and small cap index with better A/D across broader market weighs higher for bullish options.

Tuesday, April 5, 2011

Nifty and SPX in X O view

The Emerging market ETF EEM has broken out of the consolidation. Read the post here.
The etf is relatively bullish than SPX which is a major turn in the assets allocation globally.

Lets see how Nifty is performing relatively.
First Nifty vs EEM in a relative chart:


The ratio has been in range for quite some time and has is at the resistance trendline.
The 50 SMA is getting flat which is a good sign.

This shows that India is still underperformer in emerging markets.

Now hows the Nifty vs SPX. Well that's showing bullishness.
There is first breakout from the double top of X's which is highlighted. Though it is still below the bearish trendline but the ratio has rising bottoms.

So overall Nifty is for sure signs of bullishness but the months of under performance still lingers and that itself can be good trigger for buying by funds.

Socioeconomics: The Cup that counts

India winning the ICC world cup is a moment that will be cherished and remembered for a long time to come.

This event will leave a big impact on the Indians and for sure can change the dynamics of sports in India and subcontinent. The Bhupathi Paes winning the finals and becoming top seeded in doubles was all lost in the news.


The hope that was materialized will provide new confidence to Indians and this for sure will reflect in the equity markets in times to come. As of now it would be difficult to quantify the impact.

The frenzy will continue to IPL and for sure the Media sector will all be flaring up.

The equity market did cheered with close above 5900 levels. Was it the Cup effect? It seems so.
The FII ownership at 18% (as of Dec 2010) is quite low and we Indians cheered to the news.


Monday, April 4, 2011

India Sectoral Trend Weekly 1 Apr

Recovery across the sector with just only 5 in Sell mode and 12 in Buy mode. Nifty has also come to Buy mode.

This reinforces the view that stating in earlier posts that market is gonna rally after the Nifty Bullish divergence and VIX rise in tandem with Nifty.

The rise in beta indices like Realty and Infra has been with good volumes shows appetite for Indian stocks at low levels.

The broader market index BSE 500 has also come to Buy mode while the small cap index is still in Sell mode.

The IT index though is still in Neutral mode which shows that rally in more in the beaten up sectors.

The weekly color:

The breadth has improved a lot and that was evident in last weeks State of Market post.

EEM: Emerging Markets new high of 2011

Emerging markets etf EEM has made a new high of 2011 and has broken out of band of 48 and 44 levels.

The breakout has come with bullish gaps and above average volumes which is a bullish sign. The range gives a target price of 52 levels.

Worth noting is the recent uptick in the relative performance with SPX index.

Chart:


Earlier post on EEM
Charting the Emerging Markets path

Friday, April 1, 2011

Nifty: Why 2011 is not 2008? Pattern repetition not happening

The 2011 first quarter looks quite similar to 2008 first quarter in some respects.

The market makes a top and then sharply falls. Then after being sideways for 4-6 weeks a rally comes. The rally soon falters and rest is history.

But the study shows that the pattern will not repeat itself. The initial analysis suggests that the signature of the move is different but the complete answer can be know in next 2 weeks i.e. by mid April.

First the charts showing the two periods.


The pattern though looks quite similar as mentioned but the key differences are:
1. The rise after the fall has been much stronger this time.
2. The volumes are better on rise for this rally.

Analyzing the 2008 pattern the index was above the 50 week SMA for 2 weeks and then in 3rd week the index closes below the 3 weeks low. The high of that week then becomes the resistance with ~20% fall coming on break of the crucial point of breakout from 50 week SMA.


The above are quite famous pattern for any down leg and is called A-B-C pattern. More details later.

Now coming to present, the Index has come out of the 50 SMA and will close above the 50 SMA for 2nd week in a row. If we consider this week as breakout point then the weeks low at 5660 is the crucial low to be maintained. For any fall to come then the next 2 weeks will be pointer.

So the 5650 (~ lows of 5660) will be the decider for the pattern.Keep watch on those levels.